Logistics involves ongoing work with MS Excel spreadsheets. The more we know about the functions of Excel, the better our computers are, and the better we can run our reports. Excel truly helps automate day-to-day tasks, and its rich features enable logisticians to work faster and in more organized ways. Excel is an integral part of logistics and supply chain analytics along with administration and operational departments. Warehouse employees use Excel templates to fill in and print shipping documents. Office staff in logistics prepare multiple reports. Everyone in logistics uses Excel because it is cost-efficient and easy to use, making it comfortable to work with.
In this article, I'll share my personal experience with Excel in logistics. You can learn about Excel and how to adapt it to logistics. I'll give you some tips and tricks on how to improve your reporting and daily routine tasks. This article also includes ready-to-download files with various Excel formulas and functions, ready to copy-paste into your Excel spreadsheets.
Despite Excel, we'll also reveal a bit about logistics custom software solutions that have significantly changed automation. We see the impact of AI on all operations, and let's be honest: custom software solutions for logistics are worth considering. If you want a cost-effective business that is less error-prone than manual tasks and reports run by personnel on Excel, think about custom software tailored to your logistics. So, without criticizing Excel, which we still use, let's see what we have for you.
Let's explain what Excel is and what its features are
Excel is a potent spreadsheet software developed by Microsoft, and to better understand what Excel is and its functions, you should work directly with this tool daily. Excel primarily organizes, analyzes, and manipulates data in a tabular format. It means that its interface includes all the cells separated into rows and columns. Looking at the Excel sheet for the first time, you may see a net of cells dedicated to math calculation, the digital version of a paper spreadsheet.
Excel is perceived as a tool that makes all sorts of calculations more accessible. Still, its basic form has already, over the years, been extended beyond simply being a calculation tool.
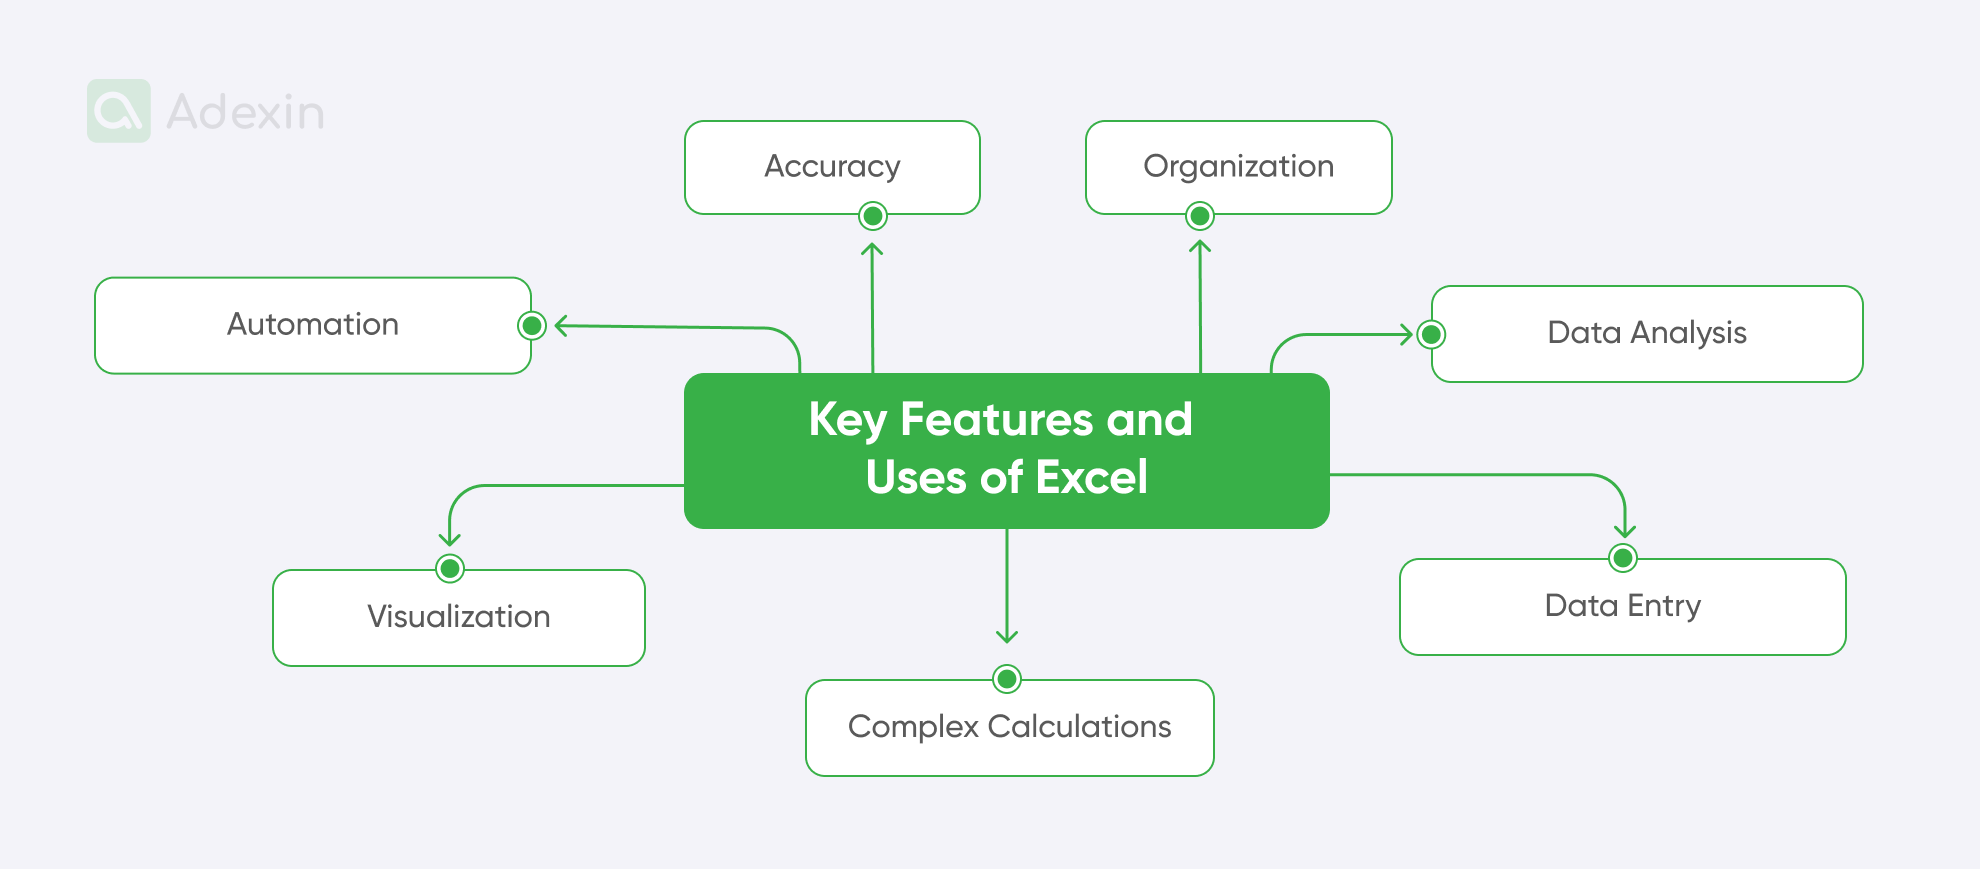
Today, key features and uses of Excel include:
Data entry and organization
You can manually input data into cells on the keyboard, format it, and arrange it in rows and columns. A scanner connected to the computer can also input data by hand. This feature is frequently used in logistics when warehouse workers scan barcodes from incoming goods registered in Excel cells. Scanning is a straightforward and helpful data registration method for logistics for small and medium-sized businesses.
Calculations
The primary function of Excel allows you to perform a wide range of calculations. There are limitless possibilities for running calculations, from simple arithmetic tasks to complex financial Excel formulas. The latter requires many more skills, but using Excel can allow you to process vast volumes of data. This is why logistics financial departments use Excel frequently, as they can quickly retrieve any data with just a few clicks using the finder function.
Data analysis
Data collected in Excel can be used to analyze shipping volumes and forecasting through functions, Excel formulas, and tools like pivot tables. It is simply the ultimate feature for business analysts in supply chain management, who can sort all the data from months backward to outline forecasts for the next quarter's inbound and outbound volumes.
Visualization
Like MS other MS Office tools, M.S. Excel is integrated with functionalities that can help present data more user-friendly. With Excel, you can create charts, graphs, and other visual representations of your data to better understand trends in logistics and present them to your stakeholders.
Accuracy
Excel helps minimize human error in performing complex calculations. While mistakes can still happen, you can improve some actions through Excel. Moreover, integrating Excel with other applications allows for seamless data transfer and analysis, reducing the need for additional data downloads from different sources.
Automation
This function is frequently used by more advanced users, and its primary purpose in Excel is a macro programming language, VBA (Visual Basic for Applications). It allows you to automate repetitive tasks and create user-friendly forms. With macros and VBA, you can develop miniatures of applications and extended tools that integrate external services and software. By using macros, you can, for example, retrieve online data to your spreadsheets on a PC to compare your resources with those available online. There are endless possibilities for using Excel in logistics. We reveal more below!

Where to use Excel?
There is probably not a single company in the logistics industry that would not use Excel in its work, because it helps solve several problems and functions that can significantly increase the efficiency and speed of any operations. Here are the typical applications of Excel in logistics:
Financial analysis
Financial teams are quite divided in logistics. Some departments are responsible for carriers and approving invoices, while others hold a bit more responsibility, taking the lead in budgeting, forecasting, and financial modeling. Basically, as in any business—whether it's a small or medium-sized company or a logistics corporation such as UPS SCS, FedEx, or DSV—some people benefit from Excel.
Data management
Excel is widely used for inventory management. Small and medium-sized businesses are not using much automation, and warehouses remain slow regarding digitalization, although custom digital transformation solutions can significantly optimize the work of any company. Warehouse clerks, such as inventory controllers, use Excel to track inventory, customer orders, and picking and packing data. They mostly create hundreds of reports for ABC analysis, dispatching reports, lost and found reports, damage item reports (mainly including root causes, etc.), and many others.
Project management
For this purpose, business analysts in logistics can create a Gantt Chart using Excel's bar chart function to visualize task timelines. You can set variations with dependencies to indicate task dependencies using Excel formulas or conditional formatting. Apart from this, assigning resources is also possible: Create a column to assign specific resources to each task. It is also essential for lower-tier functions in logistics, such as team leaders in warehouses, who create task schedules, allocate resources (primarily for hours tracking), and track work progress (for example, when it comes to loading schedules and shipping).
Statistical analysis
Anyone in logistics can benefit from Excel when conducting data analysis and generating reports. Mostly, multiple people in logistics are busy calculating measures like mean, median, mode, standard deviation, and different variances. Excel allows anybody to create Pivot Tables, which are more dynamic reports to summarize and analyze data. So, you can apply analytics with Excel again for Inventory Management, Transportation Planning, or Quality Control.
Education
Creating worksheets for employees or internal personnel for internal training purposes. As mentioned above, Excel can use macro programming, which allows the automation of parts of spreadsheets. Thanks to this, you can seamlessly switch from one spreadsheet to another, display nicely-settled charts and statistics, and even integrate it with tools like MS PowerPoint to display charts from Excel on slides in PPT presentations automatically.
5 examples of using Excel in logistics
We understand that there is quite a lot to say about Excel, and the application method is, let's say again, most likely endless. To give the best look into its usage in logistics, it's worth bringing to light some examples. I have worked in logistics preparing multiple reports, overviews, and presentations for work evaluations, analysis, and calculations, so let me share some real-life examples from logistics.
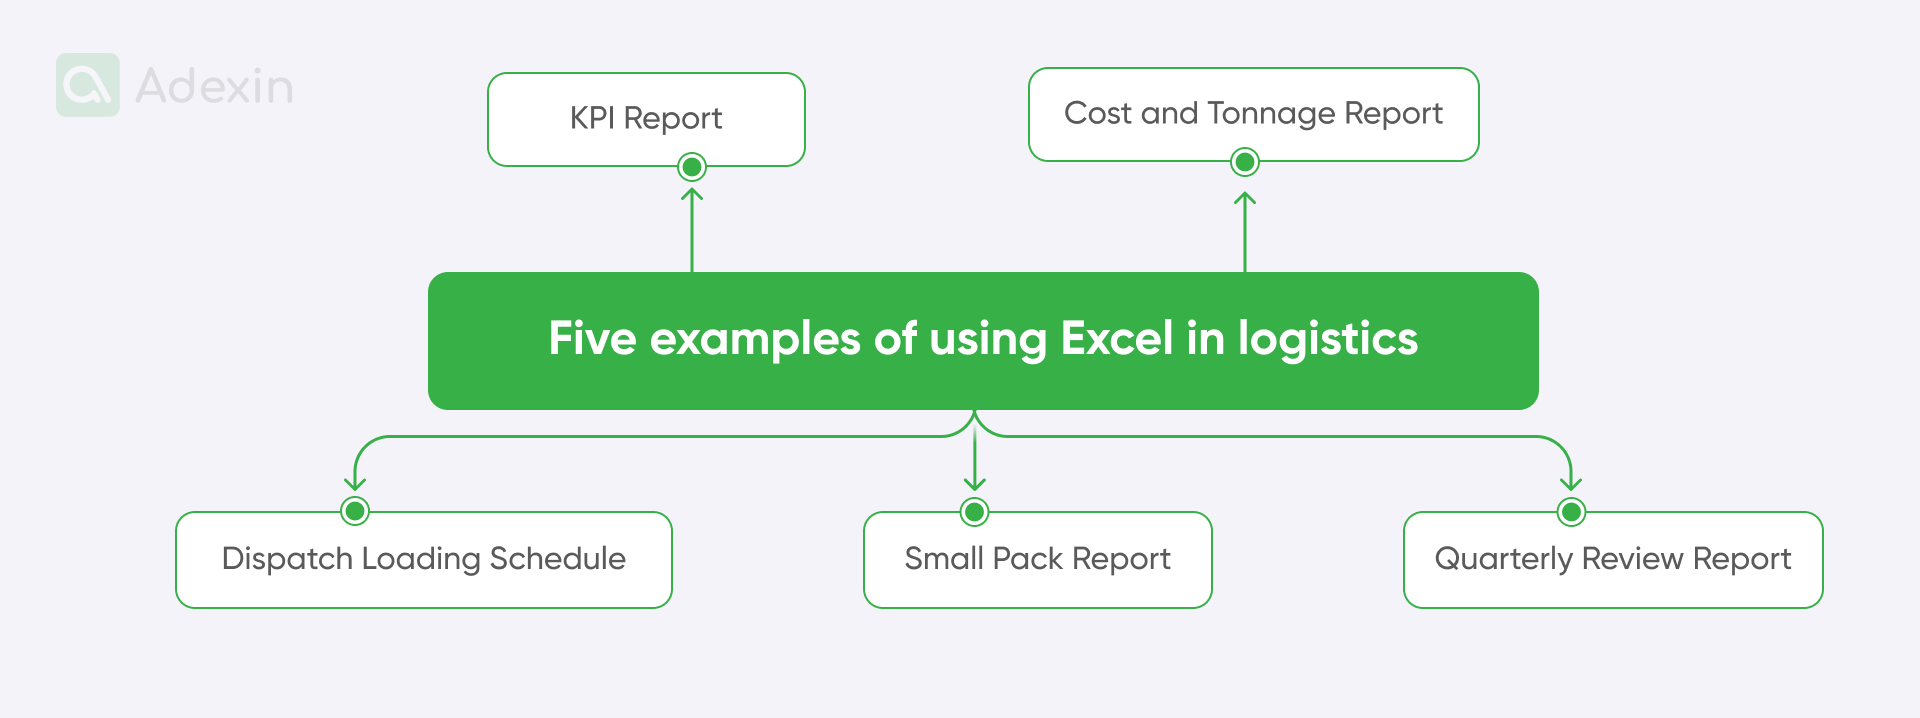
KPI report. This report tracks performance against established metrics based on contractual agreements. All data is maintained in Excel spreadsheets. Some of the metrics include On-time Delivery Rate, Average Delivery Time, Damage Rate, and Total Damages. These KPIs often encompass more than just inventory statistics and shipping details.
Cost and tonnage report maximum value. This report monitors transportation costs and the volume of goods shipped. It is often necessary to compare sheets with carriers to reach a consensus, which should be reflected in the total normalized value of the invoice to be paid.
Dispatch loading schedule. It is a straightforward file used to plan and coordinate the loading of vehicles for shipments. Logistics use statistics that include shipment orders, vehicle capacities, and driver availability for this type of report.
Small pack report. This Excel report tracks the movement and delivery of small packages. It is crucial to frequently check POD (Proof of Delivery) and compare package tracking numbers and delivery dates.
Quarterly review report. This Excel report provides a comprehensive overview of logistics operations for a specific quarter. It can include KPIs, cost and tonnage data, dispatch performance, and small pack data.
Whether utilizing Excel formulas for logistics or Excel functions for supply chain management, the goal is ultimately to automate frequently repeatable manual tasks when working with Excel spreadsheets.
4 Excel extensions for better logistics
Over the years, I have found that Excel is even more valuable when enhanced with extensions. Excel extensions are additional tools or programs that can be integrated into Excel to expand its functionality. By using them, you can cater to specific needs, and I believe many can benefit your daily tasks in logistics. These extensions can range from simple add-ins that automate tasks to powerful plugins that introduce new features or connect Excel to other software. As I mentioned, you can retrieve data from various sources into your spreadsheet with just a few clicks.
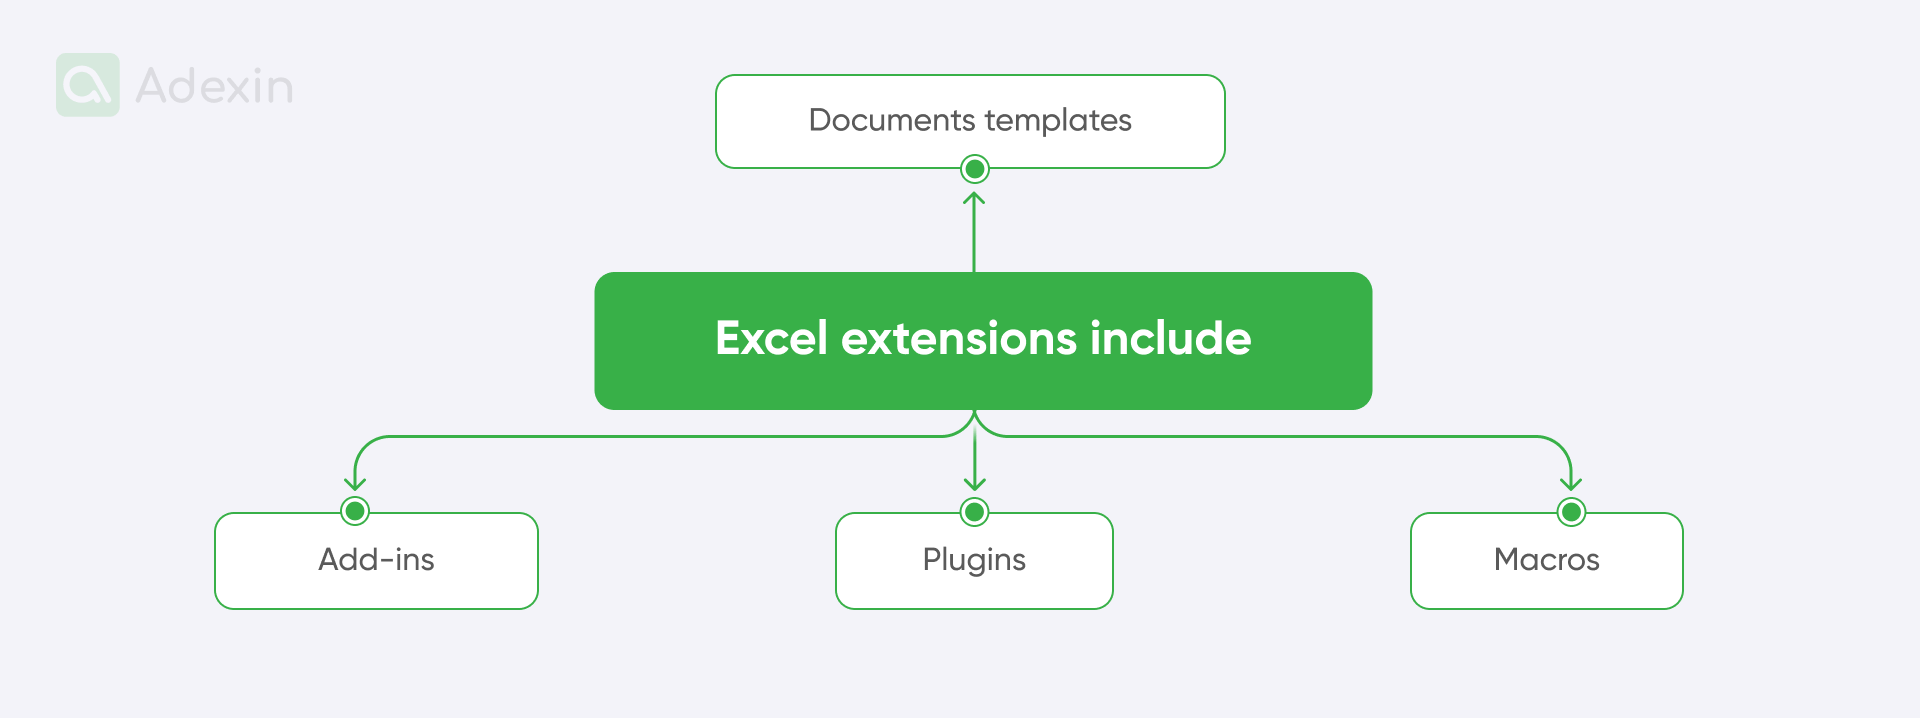
Common types of Excel extensions include:
Add-ins. These are well-known small programs that can be installed within Excel. They are quite useful for less computer-savvy users because they include new features or customize existing ones based on macros. They can automate most repetitive tasks and help create custom functions to provide more specific calculation methods. They are not as advanced as plugins but can still help simplify tasks such as VLOOKUP and others.
Plugins. Plugins are often more complex than add-ins and can integrate Excel with other software or platforms. For example, a plugin might connect Excel to a database, a CRM system, or a financial analysis tool. Nevertheless, all connections between Excel and plugins are based on macro programming. However, this is slightly different as you can download plugins that automatically connect to your menu bar in Excel, so you don't need to additionally customize your menu to get shortcuts for your most frequently used commands.
Macros. This type of plugin is more sophisticated. Macros are essentially recorded sequences of actions within Excel, so they can be used to automate repetitive tasks, such as formatting data or generating reports. You can reuse a ready set of codes to automate your Excel report calculations with Database Functions, Lookup and Reference Functions, and many others. Recently, you can ask ChatGPT to create a macro for you, so it's easier for those who only understand the logic behind the macro code.
Templates. You can download ready-to-use Excel templates pre-designed for the most common logistic documents, such as Proof of Delivery (POD), commercial invoices, EX-A documents, packing lists, balance sheets, and CMR consignment notes. These files can be customized to fit specific needs, so you can manually input data such as shipment numbers or SKU numbers of the items on the packing list, etc. They can be used to create everything from warehouse documents to logistics project plans and data analysis reports.
What is the difference between an Excel function and a formula and why should learn it?
Excel uses functions and Excel formulas. The difference between them is quite significant, and we can basically differentiate them into several characteristics. So, let's determine whether you need an Excel formula or function.
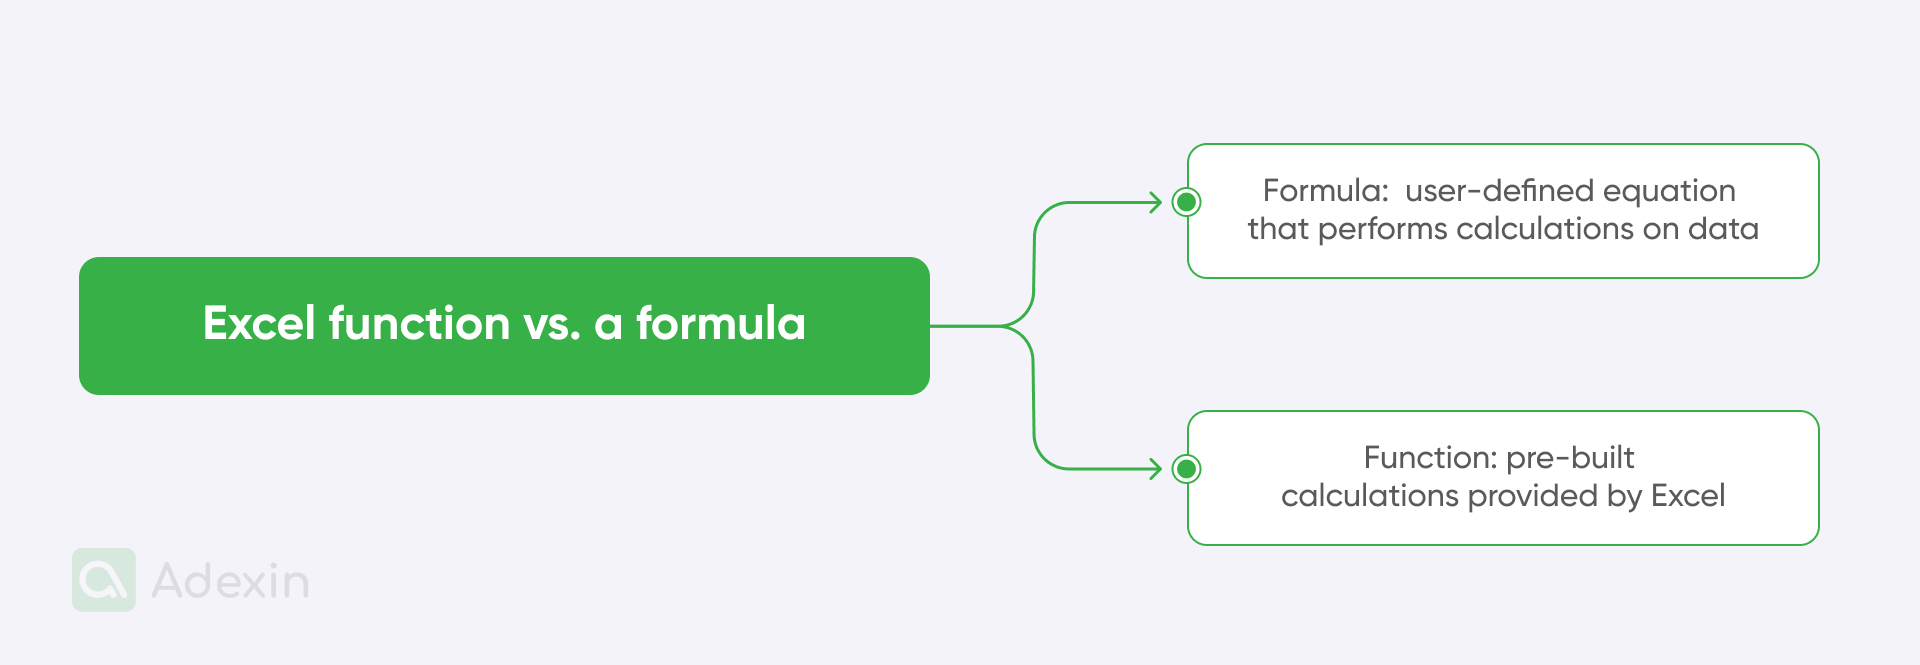
Excel formula
This is a user-defined equation that performs calculations on data within a worksheet. It combines cell references, operators, and, actually, even sometimes, functions. You can use Excel formulas to calculate a price reduction, with the example as follows:
The price reduction is 20% filled in cell C4.
The old price is $12.50 filled in cell B1.
If you place the product name in cell A1 and the old price in cell B1, then put this formula into cell C1 "=B1+(B1*$C$4)," you'll automatically receive the result of a new price, which is $9.16
So, this is how simple it is!
Excel function
Here, we have something to do with pre-built calculations provided by Excel. It is required to perform specific operations on data. Most functions can be inserted in the same field as formulas but include short names of operations such as "as AND," SUM," IF," etc. For example, you can use the "AND" function to show sales for a specific period:
Date one is 14/09/2024, filled in cell D1
Date two is 11/10/2024, filled in cell D2
Then, you have cells A1, A2, and A3 with specific dates and referral cells from B1, B2, to B3. You can easily use this function "=AND(A1>=$D$1, A2 = $D$2)" to calculate sales for the period covered between A1 and A2 in the span of A1 to A3. If you get error values, please double-check the cells.
If you're working in logistics, learning basic Excel functions and formulas is essential for automating calculations and saving time while doing your daily job. You can use functions and Excel formulas to analyze data, extracting meaningful insights from data. Having more skills in Excel supports making informed choices with accurate data. If you're a team leader in logistics, you can always make your job faster and then devote more time to personnel management rather than handling manual data input. There are undoubtedly many answers to this question. From my experience, Excel skills help in all the above and these:
Solving problems for warehouse clerks with ready-to-use templates and fewer manual actions in Excel.
Simplifying the work of the Operation Support Group (OSG) in the office near the warehouse by adding more Excel formulas and macros to Excel reports.
Modifying KPI reports with formulas and macros to provide more accurate calculations.
✅ Download the Excel function set here

10 functions of Excel sheets for logistics
It's time to highlight the ten most useful functions you can benefit from in your logistics work. We can refer to those Excel functions that are most frequently used. Despite our explanation of each function set, I will also give you examples and share with you cases where to use them in logistics. So, let's buckle up!
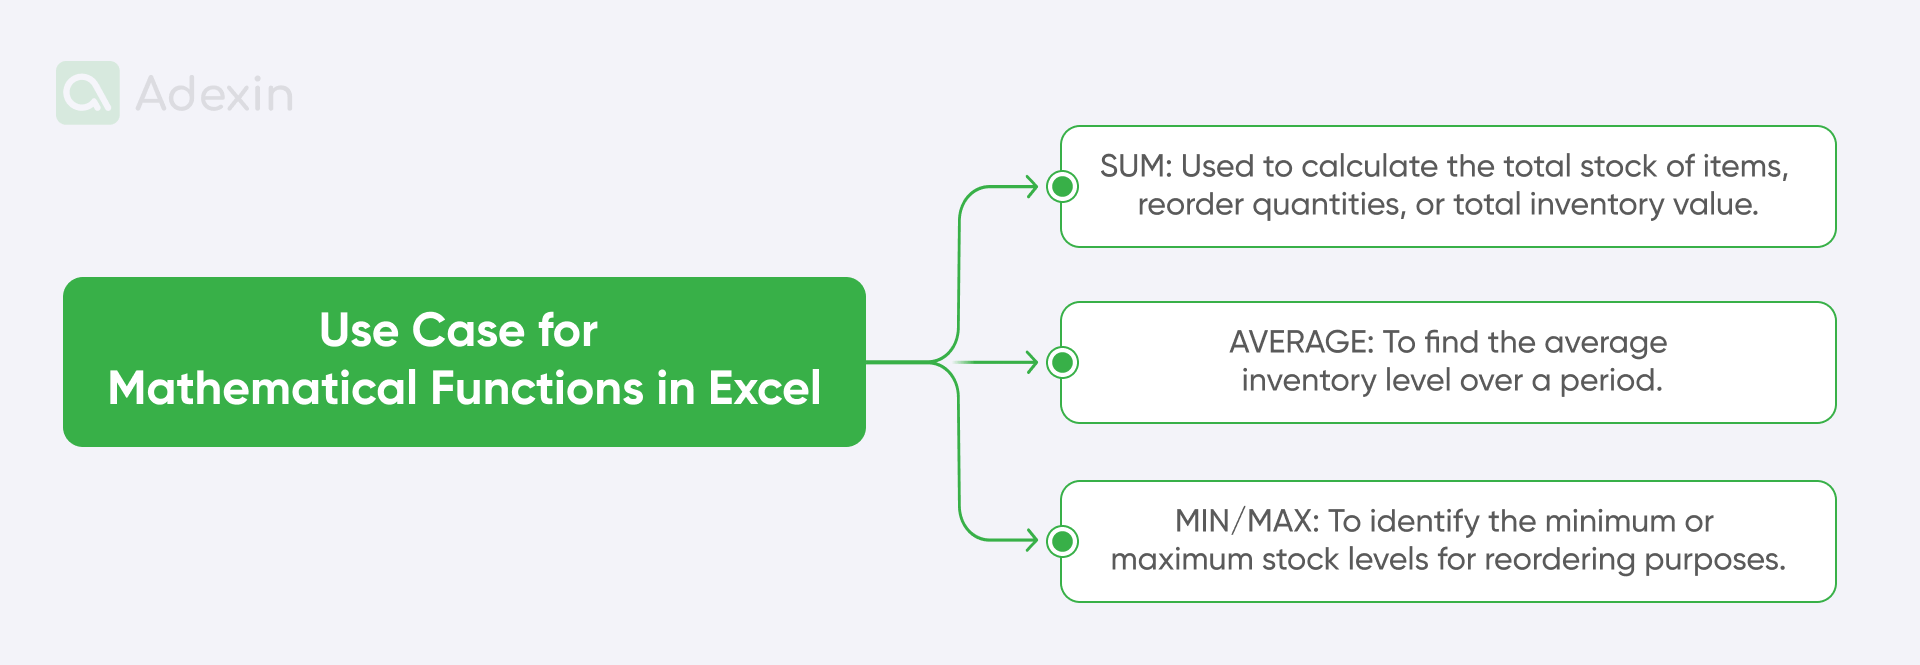
1. Mathematical functions
Here, you can perform basic arithmetic operations, including addition, subtraction, multiplication, and division. Trigonometric calculations and mathematical computations like logarithms, exponents, and rounding are more complex. These functions are built based on an alphanumeric combination of digits.
See the three brief examples below:
SUM: =SUM(A1:A10)
AVERAGE: =PERIOD(DATE(2020, 1, 1), DATE(2023, 12, 31))
MAX: =MAX(D2:D10)
MIN: =MIN(B2:B10)
For a more extended example, we can use the COUNTIF function to count phases that cost more than $2000:
Shipping LTL one costs $600 filled in cell A1
Shipping LTL two costs $2040 filled in cell A2
Shipping LTL three costs $1240 filled in cell A3
Your criteria of $2000 are in the cell B1
You can calculate it by using the formula "=COUNTIF(A1:A3,">" & B1)." The result will be given directly in the cell where you typed in the formula, and it will be one as you have only a single Shipping LTL above and equal to $2000
You may use this function whenever you want to compare a data set and find discrepancies or validate if your shipping cost exceeded the limits. Like in the case above, that can be helpful with validation LTL shipping costs.
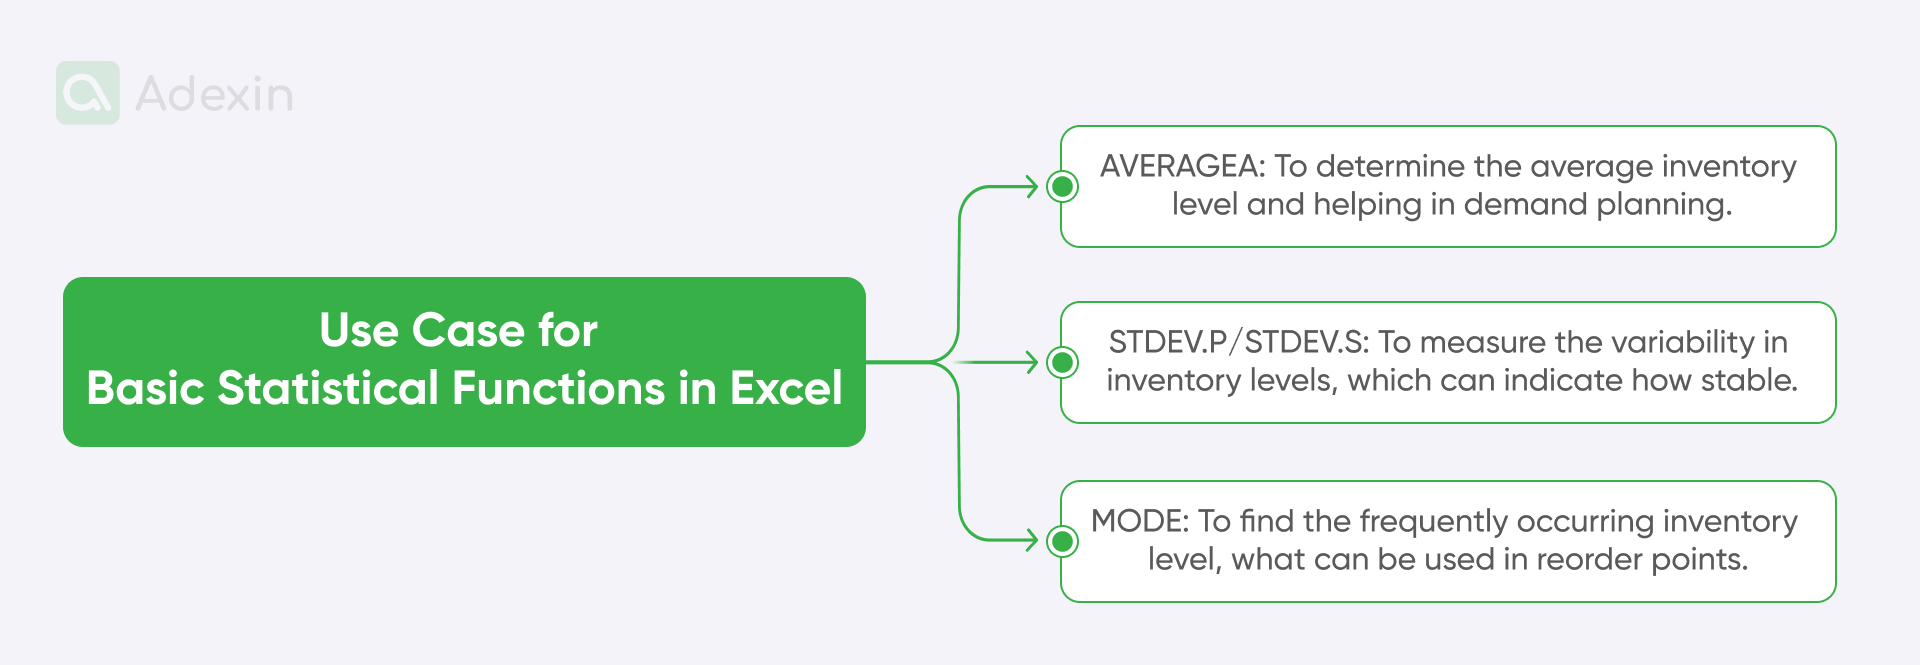
2. Statistical functions
With essential stat functions, you can calculate summary statistics for a dataset, including averagea, count, minimum, maximum, standard deviation, variance, and so on.
See a brief examples of the function:
AVERAGEA: =AVERAGE(B2:B20) - to be clear, this one is very similar to the mathematical formula AVERAGE but AVERAGEA treats text as 0 and logical values as 1 or 0, and AVERAGE ignores text and logical values
STEDV.P: =STDEV.P(1, 2, 3, 4)
MODE: =MODE(1, 2, 3, 3, 4, 5)
An example can be given by using the SMALL function to find the smallest values in a specific list:
The number of pallets in the 1st truck is two filled in cell A1
The number of pallets in the 2nd truck is 13, filled in cell A2
The number of pallets in the 3rd truck is 32, filled in cell A3
You need to point out the first smallest one, so you fill your criteria in cell B1 by just typing in the digit "1". Then, in the next cell, you should fill this formula =SMALL($A$1:$A$3,1)". Your desired result should be pointed out in data from cell A1 with the quantity of 2 pallets.
You can use this formula to check which shipment number includes the fewest pallets. It may be required in many cases: you want to see your outbound personnel overloaded with work on a certain day, or they just loaded two pallets.
3. Date and time functions
You can use that function to manipulate and calculate dates and times. These functions include adding or subtracting dates, calculating date differences, extracting specific date components (day, month, year), and formatting dates.
An example can be proposed when, let's say, you have a list of order dates in column A and want to calculate the number of days between each order date and today's date.
Order date A2 (e.g., 01/01/2024)
Today's date Use the TODAY() function: =TODAY() in cell B2
To calculate the number of days, use the DATEDIF function: =DATEDIF(A2, B2, "D") in cell C2.
This type of function can be used to calculate order processing time or determine product age or shelf life. And believe me, the aging stock is the last thing that an inventory controller wants in his stock. That function can also support scheduling tasks based on deadlines.
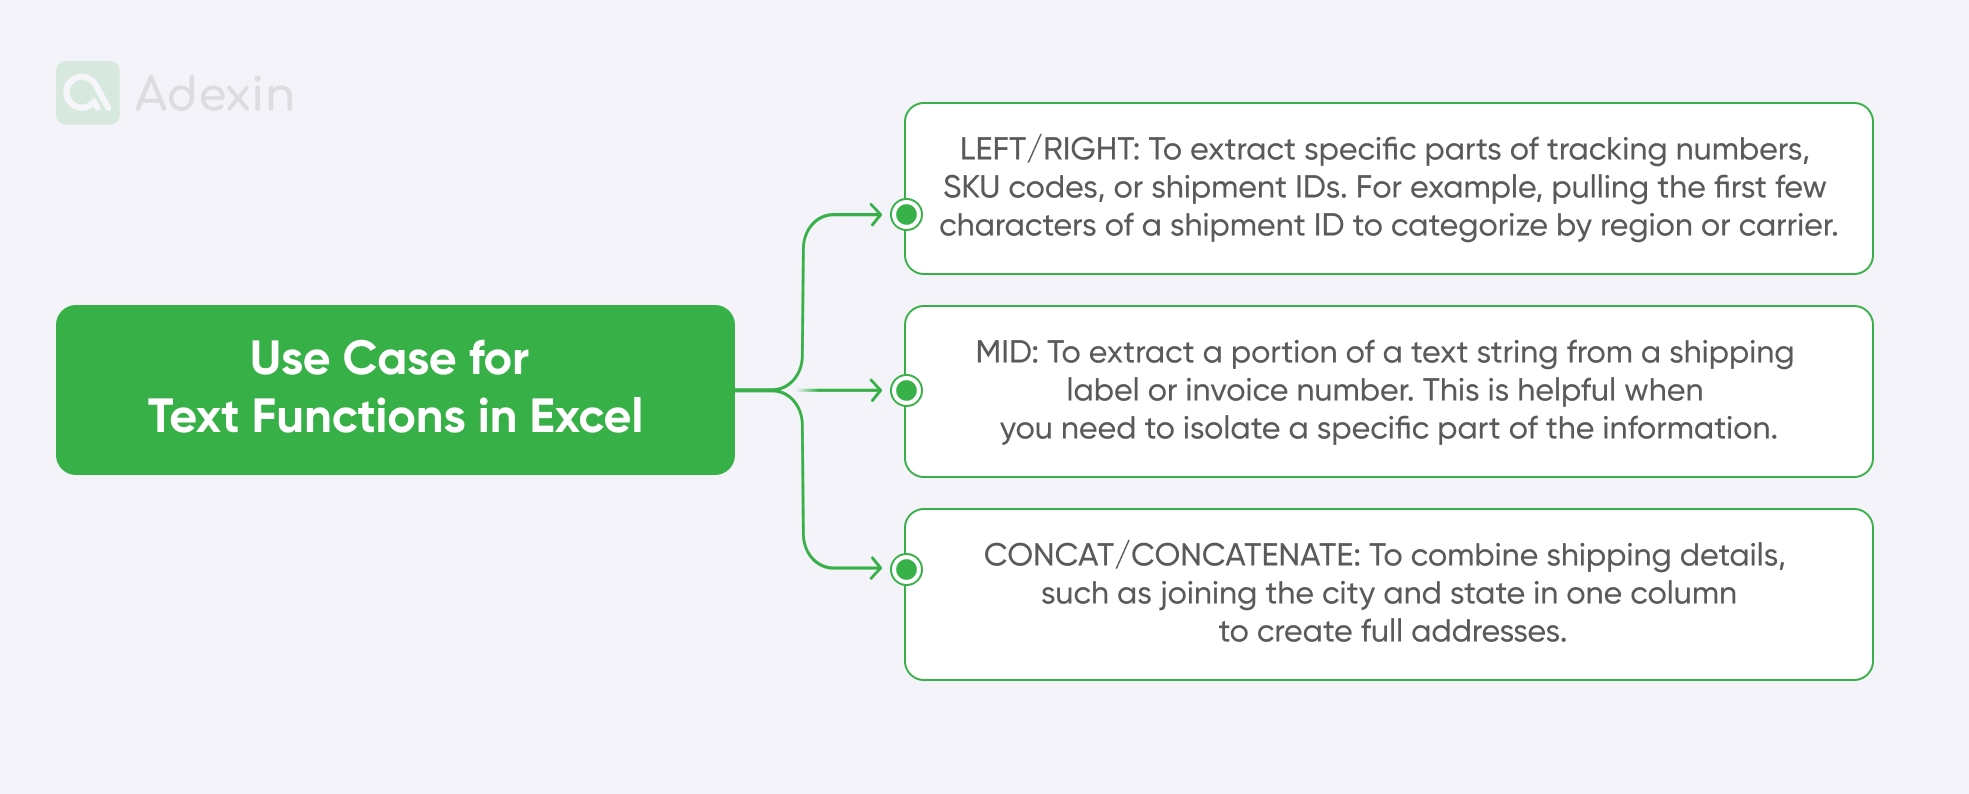
4. Text functions
These are to help you handle text data, allowing you to concatenate, extract, modify, and analyze text strings. Within text functions you can easily find and replace text. Moreover, you can convert text to numbers, and calculate text length. More examples we share in our logistics Excel templates free download file but you can get a glips also from the image below:
5. Logical functions
Well, this is a bit similar to what I already shared above. So, logical functions are dedicated to making decisions based on logical conditions. Still a bit complex, I guess, so let me explain that this is about commonly used functions like IF, AND, OR, and NOT, which allow you to create conditional statements.
By giving you an example, we can say that you have a list of sales figures in column A, and you want to classify sales as "High" if they are above $10,000, "Medium" if between $5,000 and $10,000, and "Low" otherwise. Calculation would look like this:
The sales figure was filled in A2 (e.g., 8000)
Sales category is about to use the IF function: =IF(A2>10000, "High", IF(A2>=5000, "Medium", "Low")) in cell B2
A logistics use case for this logical function involves creating conditional formatting and filtering data based on criteria. You can mark "high" or "low" whatever value you may want on your spreadsheet to see directly where to put more attention. This is not so difficult if you have one or more values, but if you have a complex report with a sheet to summarize all, it is good to highlight a drop-down in performance or another value.
6. Lookup and reference functions
This function is one of my favorites. I used it very frequently in logistics to capture required values in cost, shipping, etc. With the Lookup and Reference functions, you can find and retrieve data from different parts of a worksheet or workbook. Functions like VLOOKUP formula searches, HLOOKUP, INDEX, and MATCH are essential for data retrieval and referencing.
If I share an example with you, let's assume you have a price list with shipping fees in one sheet, including cost per load, names of carriers in column A, and corresponding prices in column B. You want to retrieve the price of a product from another sheet based on its name.
The calculation may look like this:
Product name is filled in A2 (carrier "Verhoeven Logistics B.V." or "UPS Healthcare," e.g.)
Price lookup will required to use the VLOOKUP function: =VLOOKUP(A2, Sheet2!A:B, 2, FALSE) in cell B2 (assuming the price list is in Sheet2)
Well, you may already know where to apply this formula. So you can sort out some more affordable carriers on certain distances and routes for your customers to know which shipping fees are most suitable for you to generate higher revenue. You can also create dynamic reports do more complex data analysis and calculate periodic payment values.
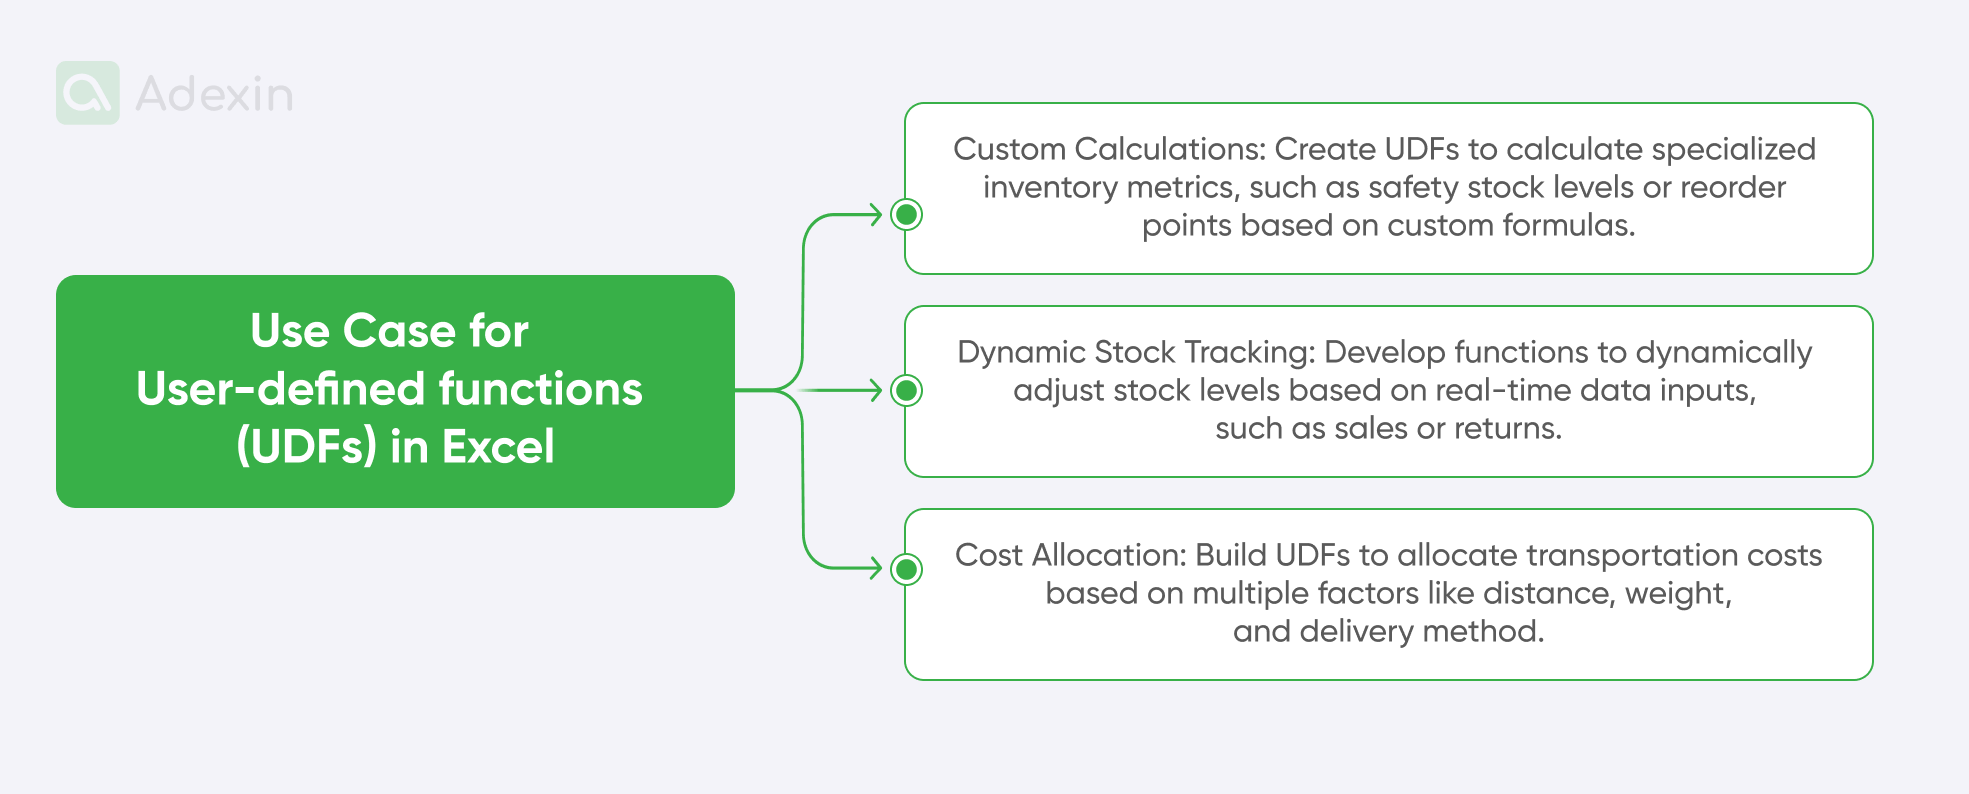
7. User-defined functions
User-defined functions are about creating custom functions tailored to specific needs using VBA (Visual Basic for Applications). These functions can automate complex calculations or perform particular tasks not covered by built-in functions. You should know more about it. I have done quite a lot with VBA. Some simple examples include creating buttons on the spreadsheet with functions executed when the button is pressed.
We cannot provide a simple VBA example here except the good image from below, as it needs to directly reflect something in the Excel file. However, you can find an example in the Excel file downloadable from this article. With a user-defined function, you might create a custom function to calculate the total cost of an order, including taxes and shipping, based on item prices, quantities, tax rates, and shipping fees.
8. Basic financial functions and net present value
With this function, you can perform financial calculations, including carrier payments, future value, present value, net present value, and depreciation. All that to figure out cumulative interest, interest paid, accrued interest, etc. To perform calculations, see the example below that includes the following:
Carrier fee amount filled in cell A2
Your interest/revenue rate filled in cell B2
Number of shipments filled in cell C2
To calculate fee per shipment use the PMT function: =PMT(B2/12, C2, A2)
You can face increasing demand during peak seasons, and shipping volumes are increasing. This formula can help you manage this Calculation at any time.
9. Database functions and advanced Excel functions
Here, you can work with data organized in tables or lists. Database functions remain quite advanced Excel functions, and among them, such as DSUM, DAVERAGE, and DCOUNT, allow you to extract and analyze data based on specific criteria.
For example, we can assume you have a database of sales data with specified columns for product, destination, and shipping. You want to calculate the total number of shipments for a specific product in a particular destination.
Product: "Product A"
Destination: Coventry UK
The total number of shipments can be calculated using the DSUM function: =DSUM(A1:C10, "shipments," criteria_range), where criteria_range specifies the product and destination (keep in mind that this time, we haven't shared an exact number of cells).
This function can be used to analyze large datasets for quarterly shipping. It is much easier than creating summary reports and performing so-called data mining.
10. Dynamic array functions
It is a new feature if we consider the long existence of Excel. It was introduced in Excel 365, and these functions produce results in arrays (multiple values) without requiring array formulas. They simplify calculations and data manipulation, offering new capabilities for data analysis. For example, you have a list of numbers in column A and want to find the unique values. The Calculation will look like this:
Numbers filled in cells A2
To calculate unique values, you should use the UNIQUE function: =UNIQUE(A2:A10)
This dynamic Array can be used for data cleaning and preparation reports. The function allows for creating dynamic ranges and performing complex calculations on arrays to calculate shipping volumes, costs, and tonnage.
Excel vs. custom software: a strong upgrade for your logistics
Excel has been a staple in many businesses for years, and logistics wasn't an exception here. But today, its limitations become apparent as operations grow and everything becomes more and more complex in logistics. Just imagine a situation where you hire a business analyst with high skills in building comprehensive Excel solutions. The cost can sometimes remain as high as for engineering and software development to have in-house. I want to say that things are blending a lot these days, and it is more difficult to say that Excel remains the most cost-effective option while Excel knowledge is in high demand too. Of course, the Excel SaaS license might be cheaper, but to get the best out of Excel, you need an Excel expert at most negligible. And I know this not from today — logistics people aren't usually Excel formulas-savvy.
Custom logistics software development offers a tailored solution that significantly enhances efficiency, accuracy, and decision-making. In many cases, custom software solutions require less human input and are, therefore, less error-prone. For example, Cumulative principal paid or auto error value spotting features can be added within custom software as a vast part of auto-reporting.
Or at least let's take a closer look at our latest work in the field of procurement. In this case, the client had to manually process huge amounts of data in Excel to systematize and prepare offers, which completely took up working time. On our side, we carried out a complete transfer functionality from Excel to web version, which significantly simplified work processes and reduced the time of operations.
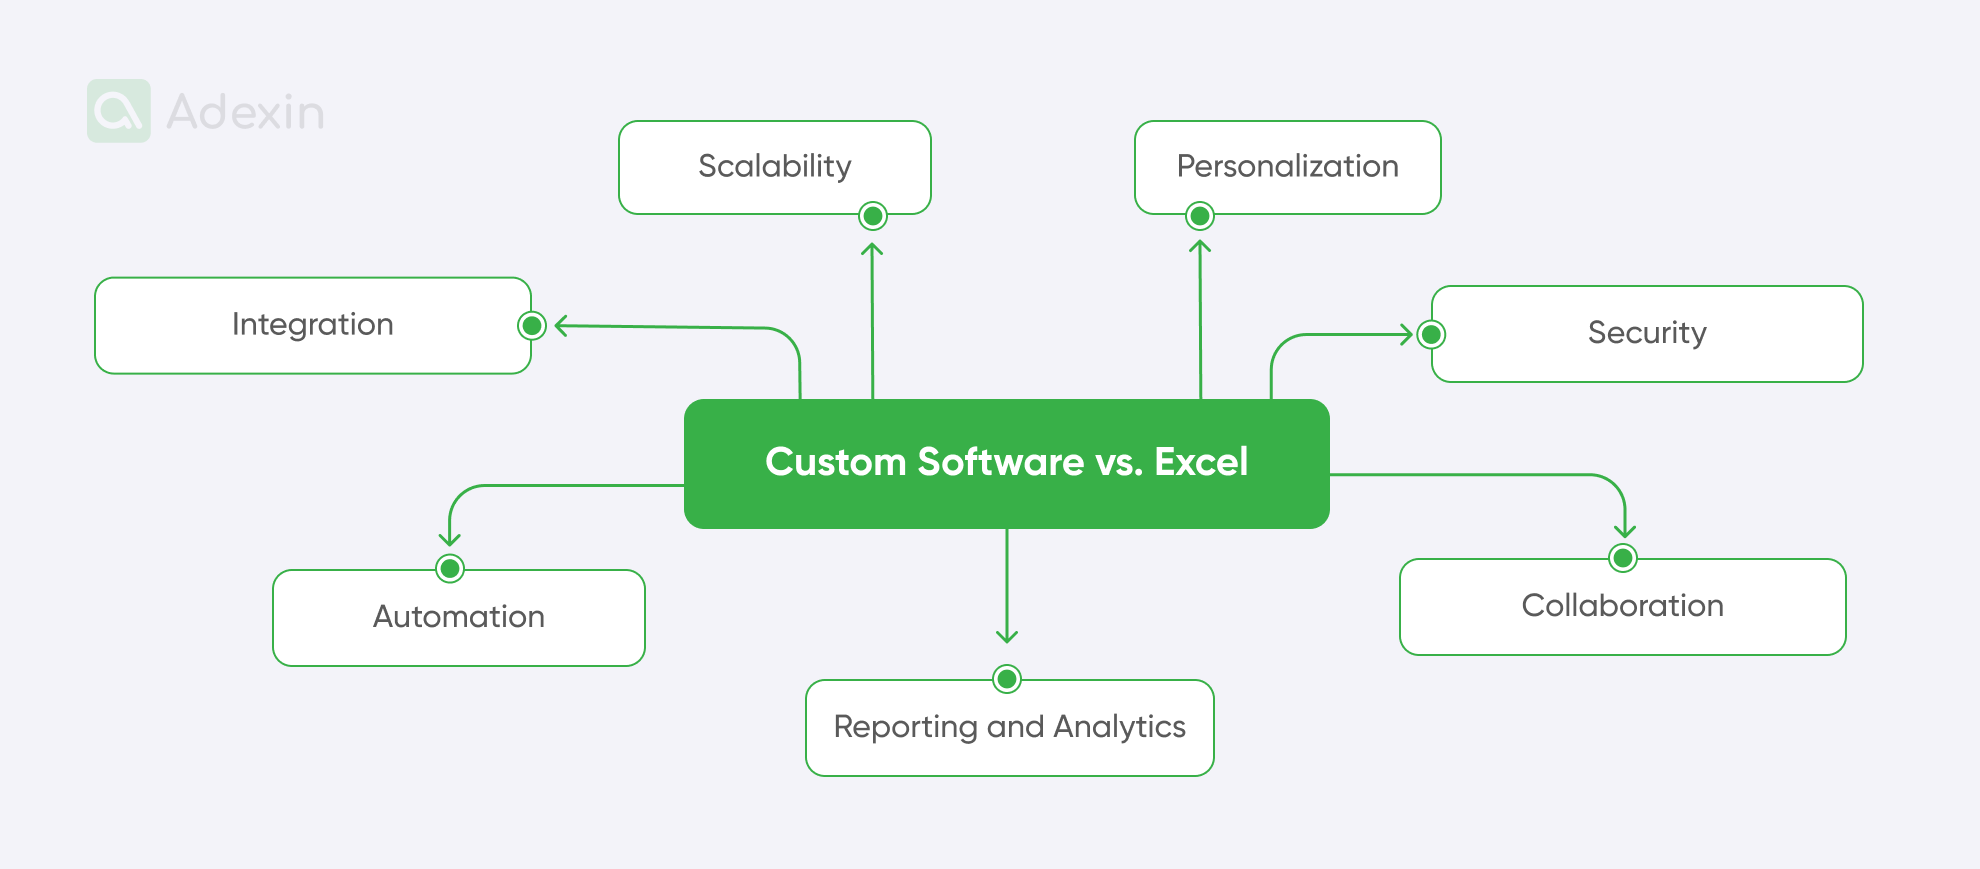
In general, let's look at a few examples of how custom software can outperform Excel:
Scalability. Excel can become slow with large data sets. Custom software is developed to handle increasing amounts of data without compromising logistics performance.
Personalization. Excel offers limited customization, but this is different from custom software, which is designed to fit specific business processes, workflows, and user preferences.
Integration. With Excel, you often need to do a lot of manual data entry and transfer. However, custom software can seamlessly integrate with other systems, hand scanners, and NFC readers to automate data flow and reduce errors.
Security. There is no secret that Excel files can be vulnerable to data breaches. Custom software can include robust security measures to protect sensitive information, which is essential because you can use various authentication levels. In contrast, an Excel sheet is mainly secured with just a password.
Automation. Repetitive tasks in Microsoft Excel can be time-consuming, and people often make many errors. Custom software can automate routine processes, freeing employees to work more effectively and efficiently in terms of working hours.
Collaboration. Multiple users can find it challenging to edit data simultaneously in Microsoft Excel. I've seen many times when Excel formulas crashed and ran super slow on shared files. Custom software provides real-time collaboration features, streamlining teamwork.
Reporting and analytics. Excel can be limited in generating complex reports and insights. As I said above, people often need more skills to run reports and analytics, and those with the skills are always super busy or too busy to handle small reporting tasks. Custom software can offer advanced analytics and reporting features.
Are you in search of a reliable tech partner?
Adexin can help with advanced logistics solutions
Contact usFinale takeaway
Excel, while a familiar tool, often falls short of meeting the demands of modern businesses and still has many challenges in logistics and supply chain. Custom software offers a superior solution in logistics by addressing key limitations. It excels in handling large datasets, providing unmatched customization, and seamlessly integrating with other systems. Enhanced security, automation, and real-time collaboration capabilities further distinguish custom software.
Is your business still relying on Excel to manage critical data and processes? Well, we may say that it's time to upgrade! We can help you with Excel integration and even replace all Excel feathers with custom software that will shift your operations and improve business logic. Contact us today for a free consultation to explore how we can tailor a solution to your specific logistics needs.

