Skillful management in logistics breaks down into several factors that facilitate our success. Regardless of the logistics, every company in the industry is obliged to a certain point to determine its Key Performance Indicators (KPIs). KPIs help build a complete picture of their transportation and warehouse operations. Thanks to them, you assess where to find the primary drivers of transportation costs and material flow. KPIs can help identify and exploit opportunities and save up to 20 or even 30% of transportation costs, but also in the warehouse. McKinsey reveals in its analytics that one example of a pharma warehouse was able to reduce process time by 20% simply by eliminating picking from the highest shelves. This couldn't have been possible without further assessments of KPIs for lead times in the order-picking process in the logistics industry.
KPIs aren't only about Lead time but also Process quality, Delivery times, sales margins, and many other metrics that can be sufficiently measured each day. As logistics aims to create the perfect order fulfillment process in the supply chain cycle, it is essential to develop a strategic map structure of the company. We need to assess success factors to design KPIs. By knowing what facilitates our success, we can become KPI killers. We actually mention this term already in our Supply Chain KPI Killers series of articles and guidelines written for managers of small and medium-sized businesses.
If you ask me what you will gain from this article, I'll tell you strategies, and I'll share my direct experience in logistics to explain how to handle KPIs. I can tell you that while I worked in a supply chain and logistics company, we maintained a 98% KPI performance each quarter. This result has shown that the success of the logistics operation can be achieved only by the joint effort of each part. I believe this article will help you become a true KPI killer. Let's buckle up!
6 steps to set up KPI in logistics and customer satisfaction
Before you become a KPI killer, it is essential to understand your business landscape and set up a logistics KPI program that will improve customer satisfaction. Your business should have a vision and mission for the company's future development. You need to identify critical success factors. This will vary from the general profile of your supply chain operations. You might focus solely on a small part of the business, but it should be well-settled and measured in every case. So, you need to set up your KPI measures. Below, we outlined several steps on how to start with KPIs.
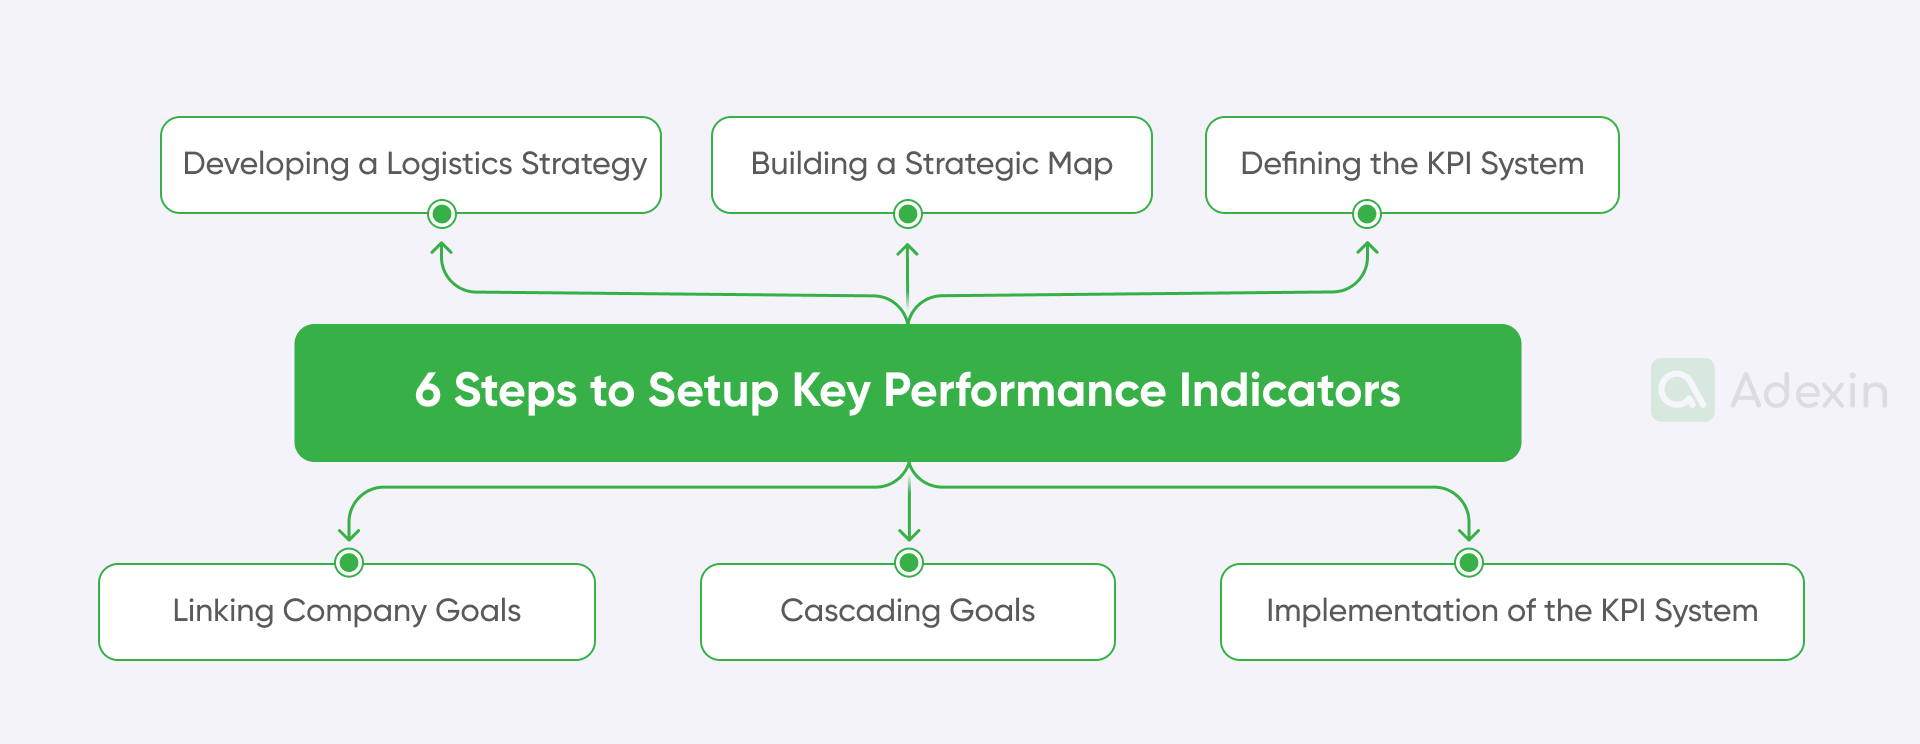
1. Developing a logistics strategy
To establish effective KPIs, start by defining your company's overall business objectives and identifying how logistics can contribute to achieving them. Conduct a SWOT analysis to assess your company's strengths, weaknesses, opportunities, and threats in logistics.
2. Building a strategic map for logistics key performance indicator
Create a visual representation of your company's strategy using a strategic map to link your vision to specific objectives and initiatives. Identify the key success factors for logistics and determine the critical metrics for measuring performance within your logistics key performance indicator.
3. Defining the KPI system
Select relevant KPIs that align with your company's strategic objectives and critical success factors. Determine how each KPI will be calculated and collected and set realistic and challenging target values. So, whatever you are obligated to do, keep in mind that you need to comply with your business capacity.
4. Linking company goals with logistics processes
Identify the processes directly impacting logistics performance and align KPIs with specific processes. Ensure that each KPI measures the performance of a relevant logistics process. This way, you can focus on what is expected of you based on customer needs. How simple it is. Isn't it?
5. Cascading goals
Break down company-level goals into departmental and individual goals to ensure everyone understands their role in achieving the logistics strategy. Align KPIs at all levels to support the company's overall goals. Keep in mind that due to the high staff rotation, you may need to set up good training programs, which are also cleared below.
6. Implementation of the KPI system
Communicate the KPI system clearly to all employees. You need to provide training and support and regularly monitor and review performance. Use data to drive continuous improvement and identify areas for enhancement in your logistics operations. You can use Excel spreadsheets to measure all volumes or custom software that will automatically point out weaknesses in your business and guide you with AI-driven tools to improve it. You can just start with a simple KPI dashboard made in Excel. More about it below.
Get a sample KPI for the logistics managers
In the introduction, I shared that we had really high KPI performance requirements after a request from one of the customers in my entire work. At that time, we had a very difficult customer from the US market. So, by combining all the factors of the entire ecosystem, I am able today to give crucial insights on how to gain successful results in the international supply chain and logistics.
Logistics KPIs examples
At the very beginning, it is crucial to tell you what are the logistics KPI examples by focusing solely on warehouse processes:
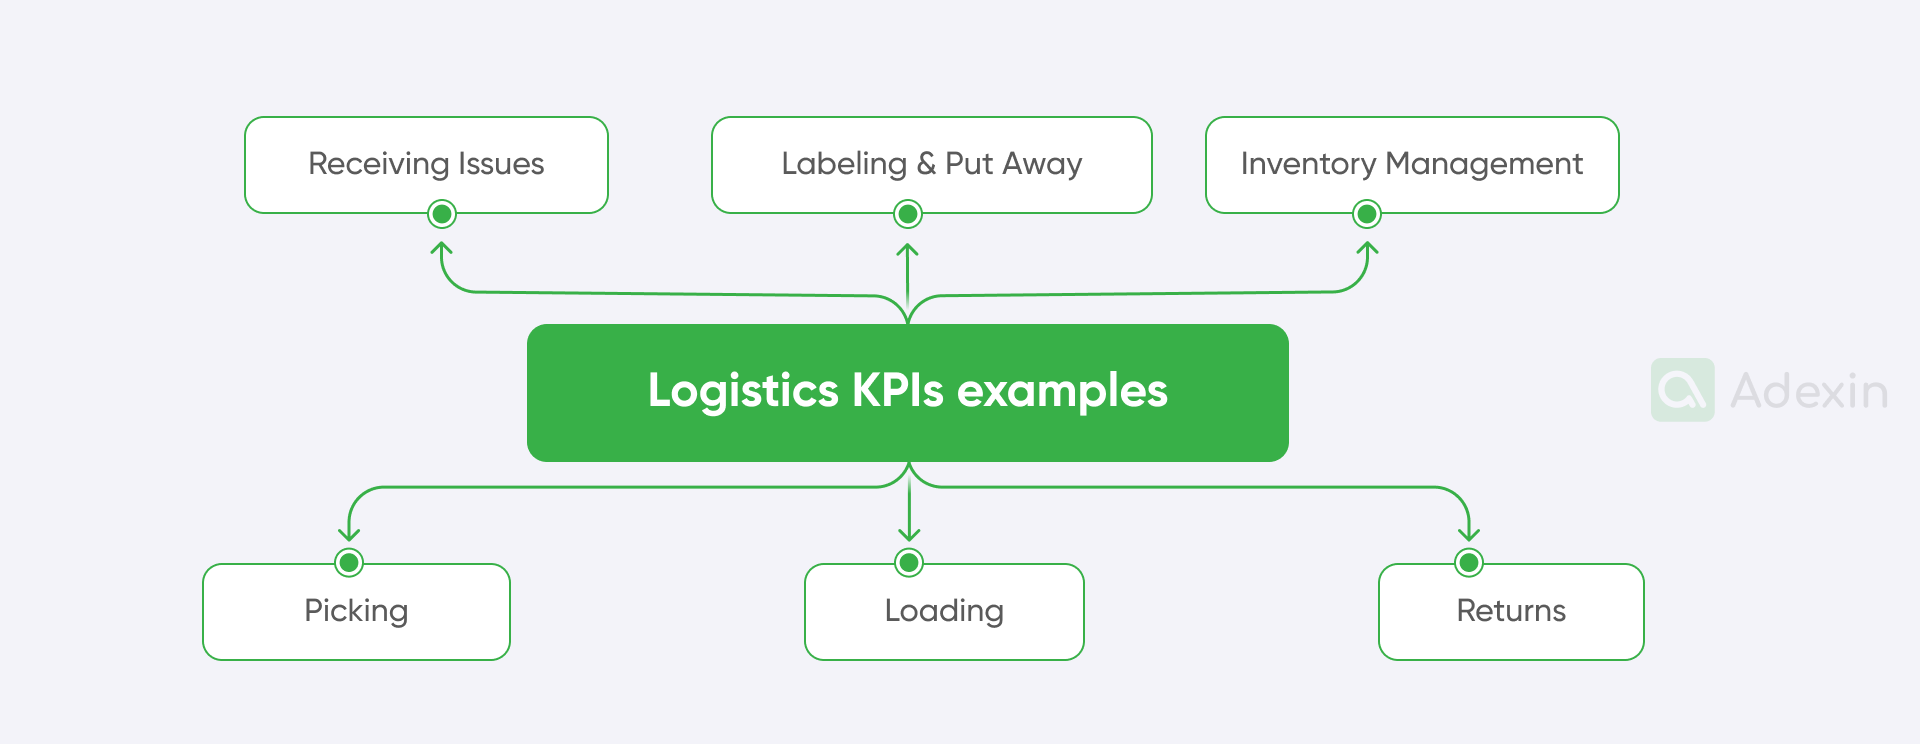
Receiving issues
These are some of the most known inbound issues. What comes in should be properly registered. So, problems can occur with new arrivals every time our staff incorrectly scans items, missing information on documents, or faces scanner malfunctions, and all need to be done manually. Receiving mistakes like miscounting and incorrect quantities are also causing significant issues.
Logistics KPI examples for receiving issues. The main KPIs regarding receiving accuracy are pointed out here. They are based on the percentage of items received correctly or receiving leave (which means the time from order placement to receiving), scanner, or system throughout the rate. We can assess where we need improvement throughout the entire period.
Labeling and putting away
How common are those issues? Yes, they're ubiquitous. They happen when your team wrongly labels products, placing items in the wrong locations. The cause of this can be missing documentation or even printer malfunction when digits and barcodes are not readable. Along with that comes inaccurate putaways.
Logistics KPI examples for labeling and putting away. KPIs here concern putaway accuracy, which combines the percentage of items placed in the correct location. It might be difficult to track, but you need to set up the right communication system. The second major KPI indicator is labeling accuracy, where you can track the percentage of items correctly labeled. It is not often to track printer uptime, but if you work in e-commerce, printer functioning might be a KPI indicator, too.
Inventory management
Inaccurate inventory data is often caused by inaccurate transfers (also away), broken pallets during unloading, mixed labels on shelves, or breakage of FIFO (First-In-First-Out) principles, which are not followed. Is all about to get higher inventory turnover.
Logistics KPI examples for inventory management. In that case, your KPIs are about inventory accuracy, where the percentage of inventory records must match physical stock. Otherwise, you get your KPI hit. In another case, the stockout rate or KPI can indicate the percentage of orders that cannot be fulfilled due to a lack of inventory. These issues are revalued during cycle count, where you can actually put addiction measures also for cycle count accuracy. This should help you track the percentage of cycle counts that match system records.
Picking for better supply chain efficiency
Well, all issues related to picking circles down to collecting the wrong item, finding out about missing items, or making mistakes during scanning. The reason for this is often outdated storage maps, incorrect system data, or even poor rack labeling.
Logistics KPI examples for picking. KPIs are about picking accuracy, so you measure the percentage of items picked correctly. There is always some volume where you can validate the first-pick rate, the percentage of items picked from the first location versus the last. In general, you can apply various measures to picking productivity, like the number of items picked per hour. See here in our article on measuring logistics time with an Excel spreadsheet. We made ready-to-use templates to download.
Loading
Good loading planning is always necessary because overloading trucks can damage your goods. However, this is not the only issue related to loading. Other reasons include document management, where your team can hand over incorrect invoices or wrong quantities printed on labels. So, yes, you need to avoid poor loading planning.
Logistics KPI examples for loading. KPIs here will be very holistic, where we are talking about order fulfillment accuracy. This indicator should show you the percentage of orders shipped with all correct items and total loading efficiency, where you are focusing on the time taken to load a truck. Other measures can also cover the damage rate, meaning the percentage of items damaged during shipping.
Returns
Properly handled returns are also significant. Issues related to returned items involve properly assessing them for damage or missing documentation. You can also face stolen returns or improper handling of incoming goods.
Logistics KPI examples for returns. So, KPIs are vital here. Return processing time refers to the time taken to process a return. You may have, for example, 1 hour to process an RMA, which helps you calculate the return rate, which will be the percentage of orders returned promptly. Later, you can measure your return-to-stock rate, which will be the percentage of returned items placed back in stock (many of them can be scrapped, so it's good to know that you preserve quality and save some stock from being reused). In e-commerce, companies often use spare parts, dismantling items and only putting spare parts in stock. It's something worth measuring as well.
Transportation and shipping KPI examples
I outlined more about shipping and transportation KPIs below. These do not exclude all operations that are closely connected to the warehouse because what happens in the warehouse can most likely also impact deliveries.
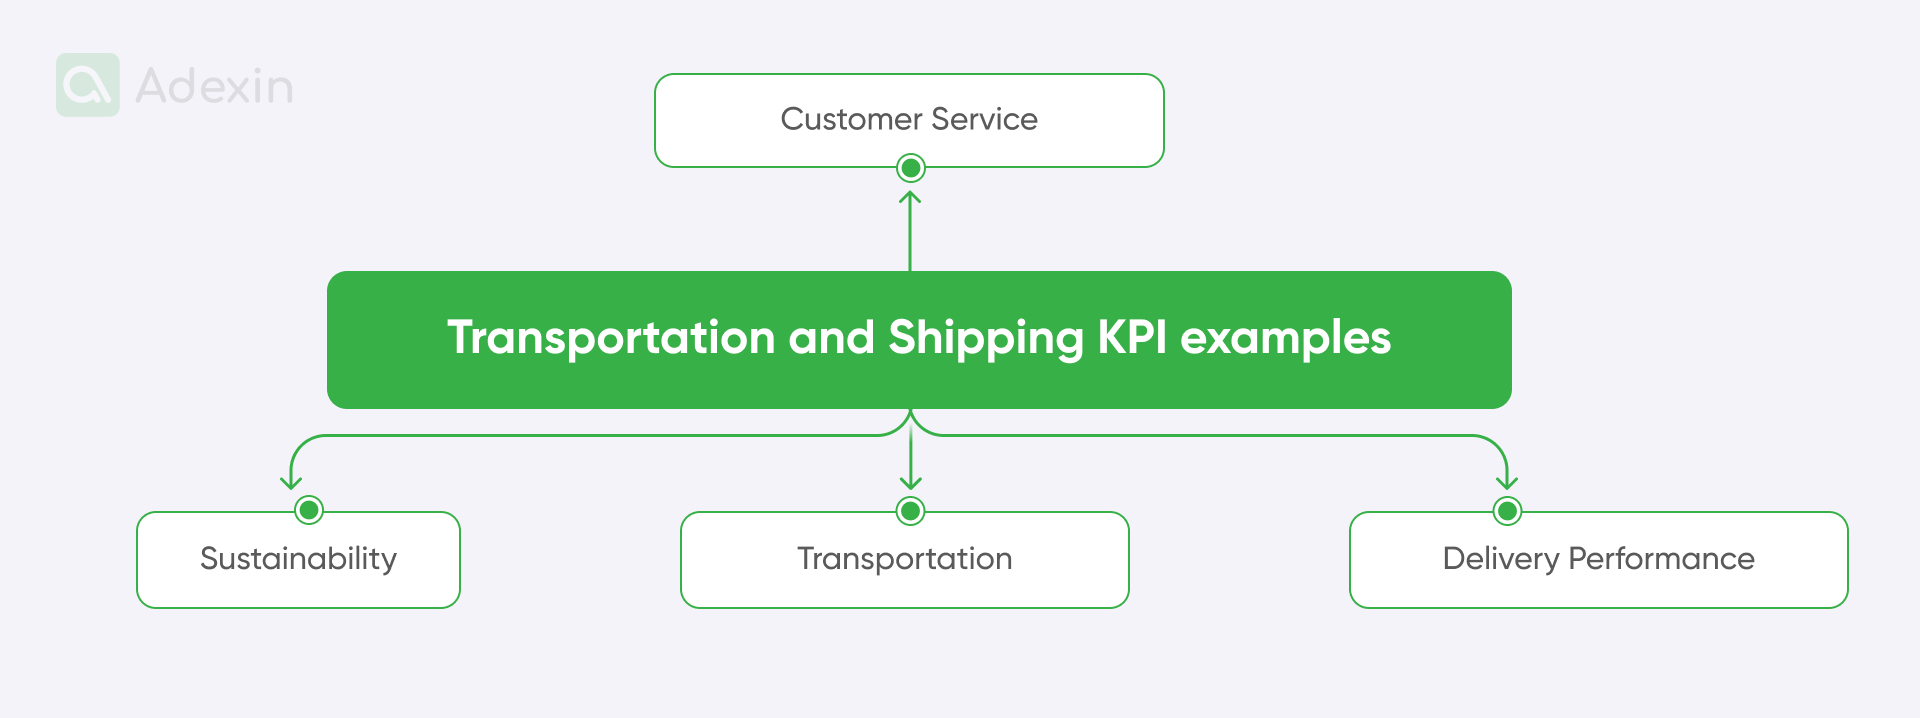
Delivery performance KPIs
The main KPIs for delivery performance are circling around several points:
On-time delivery rate. Percentage of shipments delivered on or before the promised date.
Order accuracy. Percentage of shipments delivered with the correct items and quantities.
Customer satisfaction. Measured through surveys or feedback.
General order rate. This might be a KPI that measures your percentage of shipments delivered on time, complete, and without errors.
Transportation costs KPIs
Transportation efficiency is more likely about your truck fleet performance, but you can also measure your carrier of choice's performance. Many logistics companies use a vast network of freight forwarders and carriers to follow their achievable and reasonable targets. So, you should also apply special measures. Examples of KPIs can include:
Fuel efficiency. Measures how much fuel is used per mile or kilometer.
Vehicle utilization. Measures how effectively vehicles are used to increase delivery efficiency.
Average time for the delivery process. Measures the time it takes to deliver a shipment.
Empty miles. Measure the distance traveled by cars without cargo.
Late delivery. Measures cargo delivered late without a given reason. This is sort of a delivery truck rate based on the number of shipments.
Shipment visibility. Measures the ability to track shipments in real-time.
On-time updates. Measures the frequency and accuracy of shipment updates.
Transportation costs per mile. These measures are dedicated to average transportation costs and goods per mile or kilometer.
Transportation cost per shipment. Measures the cost of transporting a shipment.
Fuel costs. Measure the total cost of fuel to optimize operations for transport.
Maintenance costs. Measures the cost of maintaining vehicles.
Sustainability KPIs
Modern logistics also measures sustainability compliance. You can use the KPIs below to better understand your waste production and how to comply with ESG regulations:
Carbon footprint. Measures the environmental impact of transportation operations.
Sustainable sourcing. Measures the use of sustainable transportation methods and fuels.
Packaging waste. Measures the amount of packaging waste generated.
Customer service KPIs
Last but not least, it is always important to measure CUS performance. This is most likely about the communication model you have established between you and your customer and this is valid for logistics KPIs. It is also important to establish proper communication between internal departments, ensuring all issues are reported to the control tower that covers KPIs is an excellent way. This will help track all incidents and problems and keep your KPI sheets current:
First-call resolution rate. Percentage of customer inquiries resolved on the first call.
Average response time. Measures the time it takes to respond to customer inquiries.
Customer complaint rate. Measures the number of customer complaints.
Logistics KPI dashboard for accurate logistics operations
From my experience, there might be two ways to get your KPI dashboard. The first way is to build a robust KPI sheet in Excel and create a KPI dashboard in Excel. This method is very cost-effective, but you need someone who is really good at Excel and understands formulas, macros, and VBA. You also need at least one person who can fix it if it breaks.
Another way is to use custom software, which is more unbreakable than macros and can be used more effectively by many people simultaneously. Moreover, simply using it to make a KPI dashboard would waste resources. So, I can tell that, most likely, you can cooperate with a custom software house, and they will build a TMS + WMS for you. Custom software can provide you with a KPI dashboard based on data acquired from WMS and TMS simultaneously. It can also be a single system that covers both areas.
An interesting example in this area is the powerful order management system (OMS) created by our developers for ITS Astra, which specializes in the procurement of school equipment and resources in the Middle East. Well, the system can work the same way for any B2B and B2B e-commerce mode, as the engine we developed is suitable for both.
Need help with order management systems development?
We are happy to assist you
Explore moreKey features of the system include:
Streamlined procurement. This feature eliminates paper catalogs and manual data entry. In fact, it allows teachers and school staff to focus on core activities.
Budget control. Managers can easily manage and approve resource lists. ensuring that purchases do not go over budget.
Automated workflow. Reduces paper consumption and automates the entire document creation process, from approval to delivery.
Faster processing. There is an easy way for requests for hundreds of items can be processed in minutes rather than days.
Real-time tracking. Managers get full visibility into logistics and supply chain management, with order tracking from request to delivery.
Data-driven information. Anyone can provide transparent analysis of suppliers and consumers, optimizing purchasing decisions.
This OMS greatly improves efficiency and transparency, helping schools effectively manage their procurement needs with no MS Excel involved.
How do you build a KPI dashboard in Excel?
As I said above, to build a KPI dashboard in Excel, it is best to have someone with a good understanding of MS Office package and Excel capabilities. If you think that will be a problem, you can hire an external company that can support you with building custom spreadsheets. So, to some extent, you can really get a good KPI sheet with a dashboard, where you can oversee all business activities.
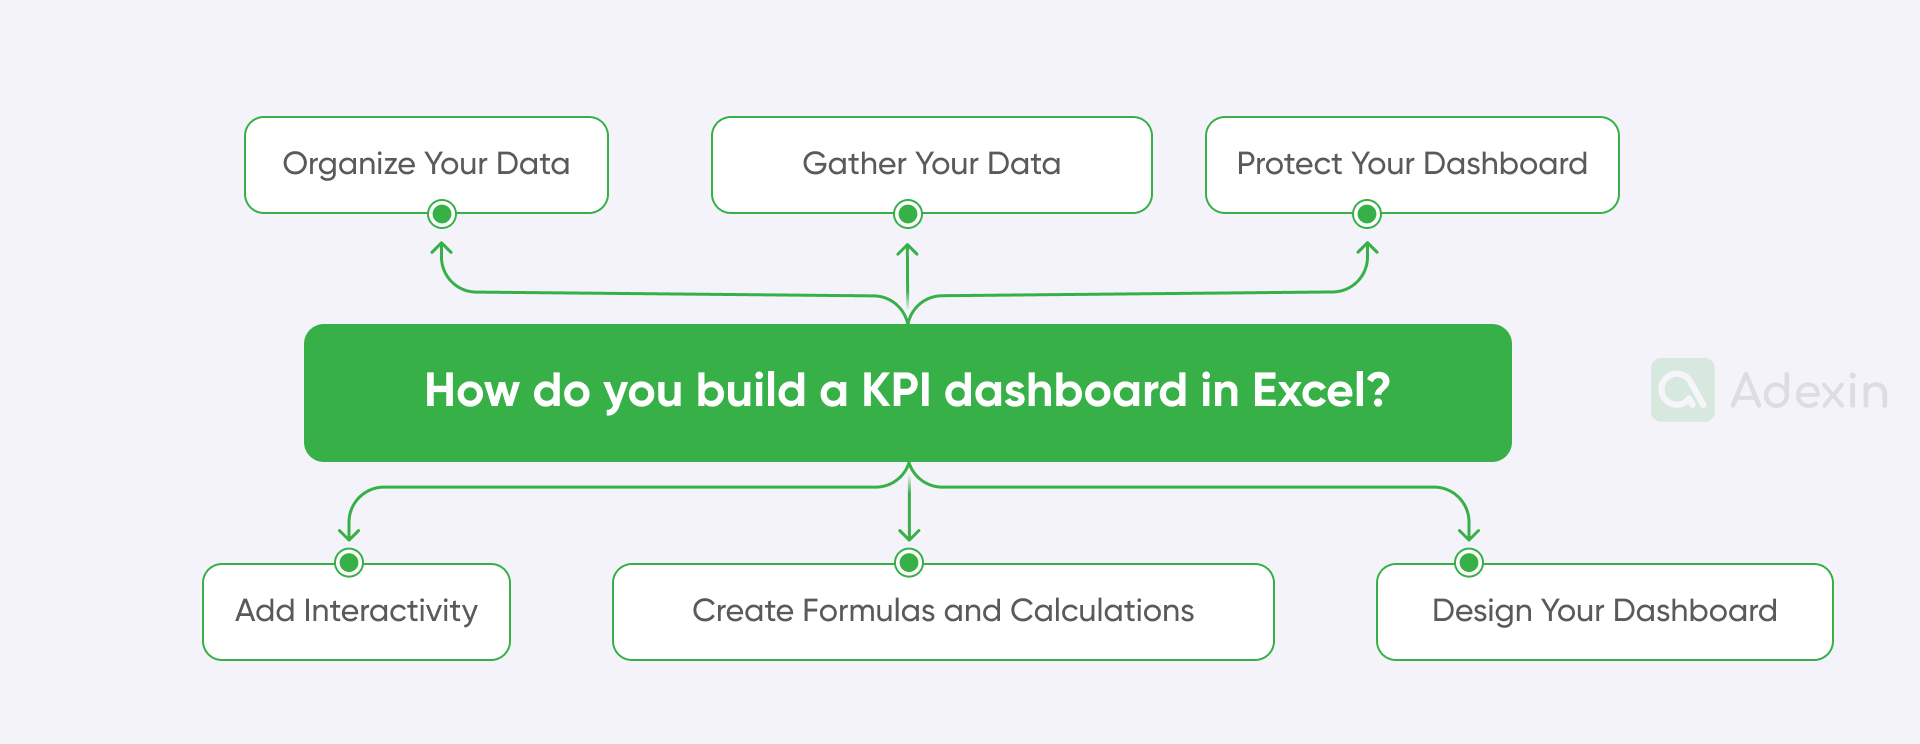
Here is a short guideline in 6 steps on how to create your KPI dashboard in Excel:
1. Gather your data
I understand that you have already identified your KPIs. When you determine the key performance indicators that are most relevant to your business goals, it's time to collect data. Gather the necessary data from your various sources (e.g., databases, spreadsheets, CRM systems, and WMS systems; you can also export some data).
2. Organize your data
Here, we start by creating a new Excel workbook. At this point, you set up a new workbook specifically for your KPI dashboard. You need to organize data into worksheets and create separate worksheets for each KPI or group of related KPIs.
3. Create formulas and calculations
It is important to automate your spreadsheet because we expect a huge volume of data. To calculate your KPIs, you should use Excel functions. Very popular functions are SUM, AVERAGE, COUNT, IF, and VLOOKUP. It is important to perceive format data. So, you should apply appropriate formatting (e.g., percentages, currency) to make your KPIs visually appealing and easy to understand. This must be a dashboard that will support operational performance and each logistics department.
4. Design your dashboard for logistics KPI
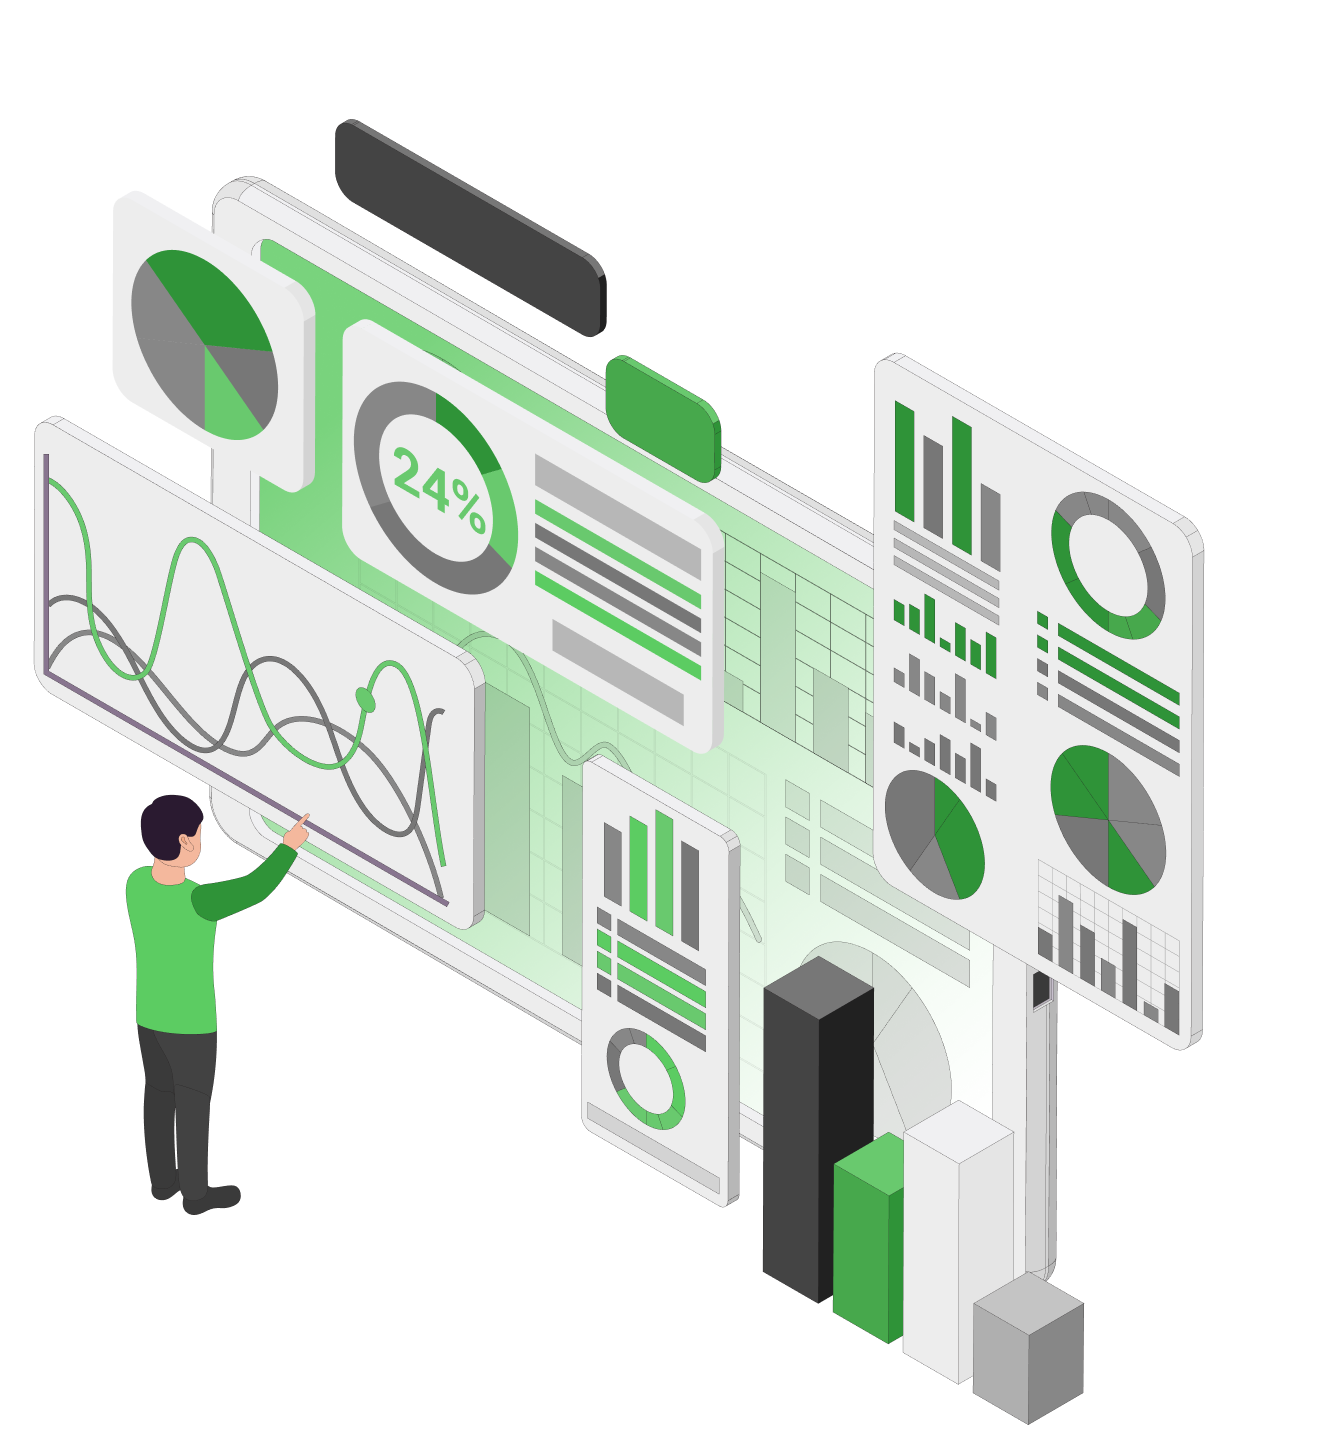
At this point, you should choose a layout for your dashboard. For that point, you can use ready elements from Excel, like charts, etc. First, think about what to select to effectively present your layout with your KPIs (e.g., tabular, graphical, which means colors). Next, use charts and graphs. At that point, you can incorporate charts (bar, line, pie, etc.) to visually represent your KPIs.
All that is supposed to be based on selected data. Next, add formatting and use colors of your choice, fonts, and borders to enhance the appearance of your dashboard. Think that you can also display this dashboard in the warehouse on TV screens, so make it clear and easy to follow.
5. Add interactivity
The next point is data validation. It is crucial to create dropdown lists or input validation to allow users to filter or customize the dashboard. You can also add slicers and timelines. So, use these tools to provide interactive filtering options.
6. Protect your dashboard and logistics metrics
As I said, data in Excel can crash. This happens mostly when many people are busy with data input. So, you should protect specific cells to prevent accidental changes to your formulas and formatting.
What are solutions for better KPI tracking and preventing KPI dropdowns?
There are many solutions available that can help you track KPIs more effectively. Some of the most popular options include digital software. Although KPIs are more about a manager's skills to help people do their jobs as best they can, today's supply chains should focus on using digital solutions. So, we outlined the most common systems that help with KPIs in the supply chain.
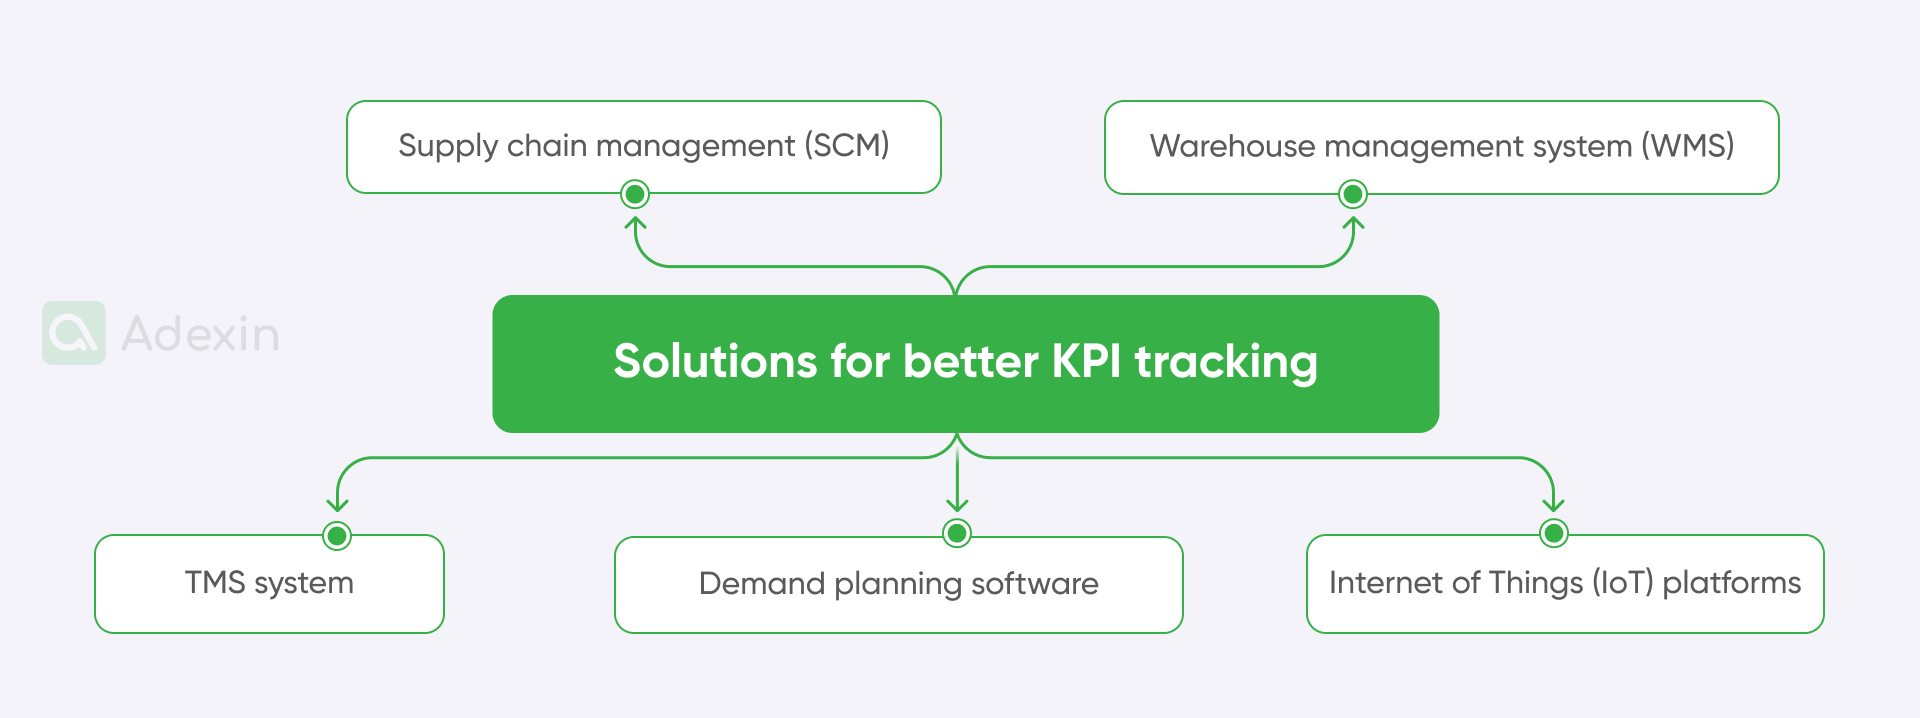
So, I overhand to you a list of digital custom-build solutions you can get for your supply chain operations to tackle down better all KPI challenges:
Supply chain management (SCM) software to track key metrics. SCM software can help you manage your entire supply chain, from procurement to delivery. This can be especially helpful for tracking KPIs related to inventory levels, lead times, and transportation costs.
Warehouse management system (WMS) software to oversee cost per unit. WMS software can help you manage warehouse operations, including inventory storage, picking, and packing. It can also help you track KPIs related to warehouse productivity and accuracy.
Transportation management system (TMS) software to shorten lead time and improve delivery services. TMS software can help you manage transportation operations, including routing, scheduling, and freight optimization. It can also help you track KPIs related to transportation costs and efficiency.
Demand planning software for better delivery accuracy. Demand planning software can help you forecast demand for your products and services. This can help track KPIs related to inventory levels and customer satisfaction.
Internet of Things (IoT) platforms to optimize warehousing costs. IoT platforms can help you collect data from sensors and other devices in your supply chain. This can help track KPIs related to asset tracking, energy consumption, and environmental impact.

What solution do you use to search for your KPIs?
You may want to hire an expert in digital solutions who understands software and can build solutions for you with Microsoft BI tools or within Excel. Keep in mind that this kind of expert isn't cheap. You'll need to pay for a single person between $96K - and $155K a year. These statistics are from 2024. So basically, the function of that person is to be a logistics business analyst who has all these skills.
Nevertheless, a single person won't be able to build a robust solution independently. You may ask me: So what? I will tell you immediately that if the problem is more complex, you must hire external experts to dive deeper into your business KPI issues. I want to say that today, custom software like WMS or TMS can cost around $30K, depending on the size of your business. If you're a small or medium-sized business, it will be even lower, in some cases $15K. For all that, you can add $2K - $5K for monthly support from a custom software company.
You'll end up with costs half lower than hiring a single Logistics Business Analyst, and you'll get support from a company with 10 years of experience in supply chain and logistics. Isn't it better to use many experts' knowledge at once? Of course, there will also be the cost of training staff, but you will still be below $155K a year.
What should you look for in custom software for better KPI:
Look for a scalable solution. As your business grows, you will need a solution to grow with you.
Make sure the solution is easy to use. You don't want to spend much time learning how to use a new software solution.
Choose a solution that integrates well with your other systems. This will make it easier to collect and analyze data.
Consider the cost of the solution. There are many different pricing models available, so be sure to compare prices before making a decision.
Get a free trial, demo, or MVP project. This will allow you to try out the software before you buy it in full version. MVP projects can cost up to 10% of the entire product.
Need help with MVP development?
Learn how we can help you
Explore moreFinale takeaway
Every logistics company must prioritize the establishment of Key Performance Indicators (KPIs) to gain a comprehensive understanding of their operations. KPIs provide valuable insights into transportation, warehousing, and overall efficiency. By analyzing KPIs, you can pinpoint areas for cost reduction, identify opportunities for improvement, and ultimately optimize your supply chain.
When building a robust KPI tracking solution, you may consider hiring a digital solutions expert specializing in software development. By opting for custom software for the supply chain, you can leverage the combined expertise of multiple professionals within the software development company. This often translates to a lower annual cost than hiring a single logistics business analyst.
Using the tips above about KPIs can improve your KPI results. Contact us today to learn more. Check out our references!


